
Search for Indicators
Healthy Aging (65+)
Indicator Gauge Icon Legend
Legend Colors
Red is bad, green is good, blue is not statistically different/neutral.
Compared to Distribution
 the value is in the best half of communities.
 the value is in the 2nd worst quarter of communities.
 the value is in the worst quarter of communities.
Compared to Target
 meets target;
  does not meet target.
Compared to a Single Value
 lower than the comparison value;
 higher than the comparison value;
 not statistically different from comparison value.
Trend

 non-significant change over time;
 significant change over time;
  no change over time.
Compared to Prior Value
 higher than the previous measurement period;
 lower than the previous measurement period;
 no statistically different change from previous measurement period.
 Significantly better than the overall value
 Significantly worse than the overall value
 Significantly different than the overall value
 No significant difference with the overall value
 No data on significance available
County: Marathon
Adults Age 65+ in Marathon County
Value
Compared to:
County: Marathon Population Over Age 65
County: Marathon Population Over Age 65
19.3%
(2022)
Compared to:


WI Value
(18.7%)
The regional value is compared to the Wisconsin State value.
US Value
(17.3%)
The regional value is compared to the national value.
Prior Value
(18.8%)
Prior Value compares a measured value with the previously measured value. Confidence intervals were not taken into account in determining the direction of the comparison.
Trend
This comparison measures the indicator’s values over multiple time periods.<br>The Mann-Kendall Test for Statistical Significance is used to evaluate the trend<br>over 4 to 10 periods of measure, subject to data availability and comparability.
County: Marathon Population Over Age 65 (Count)
County: Marathon Population Over Age 65 (Count)
25,287
People
(2018-2022)
Compared to:
Trend
This comparison measures the indicator’s values over multiple time periods.<br>The Mann-Kendall Test for Statistical Significance is used to evaluate the trend<br>over 4 to 10 periods of measure, subject to data availability and comparability.
County: Marathon People 65+ Living Below Poverty Level
County: Marathon People 65+ Living Below Poverty Level
7.5%
(2018-2022)
Compared to:
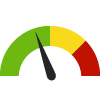

WI Counties
The distribution is based on data from 72 Wisconsin counties.
U.S. Counties
The distribution is based on data from 3,133 U.S. counties and county equivalents.
WI Value
(8.1%)
The regional value is compared to the Wisconsin State value.
US Value
(10.0%)
The regional value is compared to the national value.
Trend
This comparison measures the indicator’s values over multiple time periods.<br>The Mann-Kendall Test for Statistical Significance is used to evaluate the trend<br>over 4 to 10 periods of measure, subject to data availability and comparability.
County: Marathon People 65+ Living Below Poverty Level (Count)
County: Marathon People 65+ Living Below Poverty Level (Count)
1,850
People
(2018-2022)
Compared to:
Trend
This comparison measures the indicator’s values over multiple time periods.<br>The Mann-Kendall Test for Statistical Significance is used to evaluate the trend<br>over 4 to 10 periods of measure, subject to data availability and comparability.
County: Marathon People 65+ Living Alone
County: Marathon People 65+ Living Alone
27.8%
(2018-2022)
Compared to:
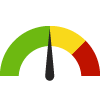


WI Counties
The distribution is based on data from 72 Wisconsin counties.
U.S. Counties
The distribution is based on data from 3,133 U.S. counties and county equivalents.
WI Value
(29.3%)
The regional value is compared to the Wisconsin State value.
US Value
(26.4%)
The regional value is compared to the national value.
Trend
This comparison measures the indicator’s values over multiple time periods.<br>The Mann-Kendall Test for Statistical Significance is used to evaluate the trend<br>over 4 to 10 periods of measure, subject to data availability and comparability.
County: Marathon People 65+ Living Alone (Count)
County: Marathon People 65+ Living Alone (Count)
7,029
People
(2018-2022)
Compared to:
Trend
This comparison measures the indicator’s values over multiple time periods.<br>The Mann-Kendall Test for Statistical Significance is used to evaluate the trend<br>over 4 to 10 periods of measure, subject to data availability and comparability.
County: Marathon Adults 65+ with a Disability
County: Marathon Adults 65+ with a Disability
30.5%
(2018-2022)
Compared to:


WI Value
(29.2%)
The regional value is compared to the Wisconsin State value.
US Value
(33.3%)
The regional value is compared to the national value.
Trend
This comparison measures the indicator’s values over multiple time periods.<br>The Mann-Kendall Test for Statistical Significance is used to evaluate the trend<br>over 4 to 10 periods of measure, subject to data availability and comparability.
County: Marathon Adults 65+ with a Hearing Difficulty
County: Marathon Adults 65+ with a Hearing Difficulty
12.7%
(2018-2022)
Compared to:

WI Value
(13.0%)
The regional value is compared to the Wisconsin State value.
US Value
(13.7%)
The regional value is compared to the national value.
Trend
This comparison measures the indicator’s values over multiple time periods.<br>The Mann-Kendall Test for Statistical Significance is used to evaluate the trend<br>over 4 to 10 periods of measure, subject to data availability and comparability.
County: Marathon Adults 65+ with a Self-Care Difficulty
County: Marathon Adults 65+ with a Self-Care Difficulty
6.8%
(2018-2022)
Compared to:
WI Value
(5.5%)
The regional value is compared to the Wisconsin State value.
US Value
(7.4%)
The regional value is compared to the national value.
Trend
This comparison measures the indicator’s values over multiple time periods.<br>The Mann-Kendall Test for Statistical Significance is used to evaluate the trend<br>over 4 to 10 periods of measure, subject to data availability and comparability.
County: Marathon Adults 65+ with a Vision Difficulty
County: Marathon Adults 65+ with a Vision Difficulty
3.8%
(2018-2022)
Compared to:
WI Value
(4.5%)
The regional value is compared to the Wisconsin State value.
US Value
(6.0%)
The regional value is compared to the national value.
Trend
This comparison measures the indicator’s values over multiple time periods.<br>The Mann-Kendall Test for Statistical Significance is used to evaluate the trend<br>over 4 to 10 periods of measure, subject to data availability and comparability.
County: Marathon Adults 65+ with an Independent Living Difficulty
County: Marathon Adults 65+ with an Independent Living Difficulty
12.6%
(2018-2022)
Compared to:

WI Value
(10.4%)
The regional value is compared to the Wisconsin State value.
US Value
(13.6%)
The regional value is compared to the national value.
Trend
This comparison measures the indicator’s values over multiple time periods.<br>The Mann-Kendall Test for Statistical Significance is used to evaluate the trend<br>over 4 to 10 periods of measure, subject to data availability and comparability.
County: Marathon Persons with an Ambulatory Difficulty
County: Marathon Persons with an Ambulatory Difficulty
5.7%
(2018-2022)
Compared to:
WI Value
(5.7%)
The regional value is compared to the Wisconsin State value.
US Value
(6.7%)
The regional value is compared to the national value.
Trend
This comparison measures the indicator’s values over multiple time periods.<br>The Mann-Kendall Test for Statistical Significance is used to evaluate the trend<br>over 4 to 10 periods of measure, subject to data availability and comparability.
County: Marathon Adults 65+ who Received Recommended Preventive Services: Females
County: Marathon Adults 65+ who Received Recommended Preventive Services: Females
33.3%
(2020)
Compared to:


WI Counties
The distribution is based on data from 72 Wisconsin counties.
U.S. Counties
The distribution is based on data from 3,141 U.S. counties and county equivalents.
US Value
(37.9%)
The regional value is compared to the national value.
County: Marathon Adults 65+ who Received Recommended Preventive Services: Males
County: Marathon Adults 65+ who Received Recommended Preventive Services: Males
38.1%
(2020)
Compared to:
WI Counties
The distribution is based on data from 72 Wisconsin counties.
U.S. Counties
The distribution is based on data from 3,141 U.S. counties and county equivalents.
US Value
(43.7%)
The regional value is compared to the national value.
County: Marathon
Falls
Value
Compared to:
County: Marathon Age-Adjusted Death Rate due to Falls
County: Marathon Age-Adjusted Death Rate due to Falls
20.0
Deaths per 100,000 population
(2020-2022)
Compared to:
WI Counties
The distribution is based on data from 68 Wisconsin counties.
WI Value
(24.5)
The regional value is compared to the Wisconsin State value.
US Value
(10.3 in 2020)
The regional value is compared to the national value. The source for the national value is Centers for Disease Control and Prevention
Prior Value
(16.6)
Prior Value compares a measured value with the previously measured value. Confidence intervals were taken into account in determining the direction of the comparison.
Trend
This comparison measures the indicator’s values over multiple time periods.<br>The Mann-Kendall Test for Statistical Significance is used to evaluate the trend<br>over 4 to 10 periods of measure, subject to data availability and comparability.
County: Marathon Number of Deaths due to Falls
County: Marathon Number of Deaths due to Falls
48
Number
(2022)
Compared to:


Prior Value
(30)
Prior Value compares a measured value with the previously measured value. Confidence intervals were not taken into account in determining the direction of the comparison.
Trend
This comparison measures the indicator’s values over multiple time periods.<br>The Mann-Kendall Test for Statistical Significance is used to evaluate the trend<br>over 4 to 10 periods of measure, subject to data availability and comparability.
County: Marathon Number of Emergency Department Visits due to Falls
County: Marathon Number of Emergency Department Visits due to Falls
2,293
Number
(2022)
Compared to:
Prior Value
(2,273)
Prior Value compares a measured value with the previously measured value. Confidence intervals were not taken into account in determining the direction of the comparison.
Trend
This comparison measures the indicator’s values over multiple time periods.<br>The Mann-Kendall Test for Statistical Significance is used to evaluate the trend<br>over 4 to 10 periods of measure, subject to data availability and comparability.
County: Marathon Number of Hospitalizations due to Falls
County: Marathon Number of Hospitalizations due to Falls
355
Number
(2022)
Compared to:
Prior Value
(341)
Prior Value compares a measured value with the previously measured value. Confidence intervals were not taken into account in determining the direction of the comparison.
Trend
This comparison measures the indicator’s values over multiple time periods.<br>The Mann-Kendall Test for Statistical Significance is used to evaluate the trend<br>over 4 to 10 periods of measure, subject to data availability and comparability.
County: Marathon Number of Fall-Related EMS Calls (Age 60+)
County: Marathon Number of Fall-Related EMS Calls (Age 60+)
2,383
(2023)
Compared to:
Prior Value
(2,389)
Prior Value compares a measured value with the previously measured value. Confidence intervals were not taken into account in determining the direction of the comparison.
Trend
This comparison measures the indicator’s values over multiple time periods.<br>The Mann-Kendall Test for Statistical Significance is used to evaluate the trend<br>over 4 to 10 periods of measure, subject to data availability and comparability.
