
Search for Indicators
Children's Resource Center - North Dashboard
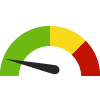
Indicator Gauge Icon Legend
Legend Colors
Red is bad, green is good, blue is not statistically different/neutral.
Compared to Distribution
 the value is in the best half of communities.
 the value is in the 2nd worst quarter of communities.
 the value is in the worst quarter of communities.
Compared to Target
 meets target;
  does not meet target.
Compared to a Single Value
 lower than the comparison value;
 higher than the comparison value;
 not statistically different from comparison value.
Trend

 non-significant change over time;
 significant change over time;
  no change over time.
Compared to Prior Value
 higher than the previous measurement period;
 lower than the previous measurement period;
 no statistically different change from previous measurement period.
Number of Families Who Contacted the Children's Resource Center - North
Value
Compared to:
Number of Families Who Contacted the Children's Resource Center - North County: Marathon
Number of Families Who Contacted the Children's Resource Center - North County: Marathon
40
Number of families
(2023)
Compared to:
Prior Value
(22)
Prior Value compares a measured value with the previously measured value. Confidence intervals were not taken into account in determining the direction of the comparison.
Trend
This comparison measures the indicator’s values over multiple time periods.<br>The Mann-Kendall Test for Statistical Significance is used to evaluate the trend<br>over 4 to 10 periods of measure, subject to data availability and comparability.
Families Who were Connected to the Services They Needed from Children's Resource Center - North
Value
Compared to:
Families Who were Connected to the Services They Needed from Children's Resource Center - North County: Marathon
Families Who were Connected to the Services They Needed from Children's Resource Center - North County: Marathon
70.0%
(2023)
Compared to:
Prior Value
(68.0%)
Prior Value compares a measured value with the previously measured value. Confidence intervals were not taken into account in determining the direction of the comparison.
Trend
This comparison measures the indicator’s values over multiple time periods.<br>The Mann-Kendall Test for Statistical Significance is used to evaluate the trend<br>over 4 to 10 periods of measure, subject to data availability and comparability.
Percent of Children with Disabilities/Special Healthcare Needs that have a Medical Home
Value
Compared to:
Percent of Children with Disabilities/Special Healthcare Needs that have a Medical Home State: Wisconsin
Percent of Children with Disabilities/Special Healthcare Needs that have a Medical Home State: Wisconsin
47.5%
(2022)
Compared to:
Prior Value
(47.0%)
Prior Value compares a measured value with the previously measured value. Confidence intervals were not taken into account in determining the direction of the comparison.
Trend
This comparison measures the indicator’s values over multiple time periods.<br>The Mann-Kendall Test for Statistical Significance is used to evaluate the trend<br>over 4 to 10 periods of measure, subject to data availability and comparability.
