
Search for Indicators
Marathon County Middle School Youth Risk Behavior Survey
View all Youth Risk Behavior Survey indicators for middle school (6th-8th grade) students in Marathon County.
Indicator Gauge Icon Legend
Legend Colors
Red is bad, green is good, blue is not statistically different/neutral.
Compared to Distribution
 the value is in the best half of communities.
 the value is in the 2nd worst quarter of communities.
 the value is in the worst quarter of communities.
Compared to Target
 meets target;
  does not meet target.
Compared to a Single Value
 lower than the comparison value;
 higher than the comparison value;
 not statistically different from comparison value.
Trend

 non-significant change over time;
 significant change over time;
  no change over time.
Compared to Prior Value
 higher than the previous measurement period;
 lower than the previous measurement period;
 no statistically different change from previous measurement period.
Health / Adolescent Health
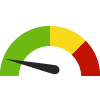
Bullying is a Problem at School (Middle School) County: Marathon
Bullying is a Problem at School (Middle School) County: Marathon
36.0%
Percent of middle school students
(2021)
Compared to:
Prior Value
(40.0%)
Prior Value compares a measured value with the previously measured value. Confidence intervals were taken into account in determining the direction of the comparison.
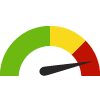
Electronic Bullying (Middle School) County: Marathon
Electronic Bullying (Middle School) County: Marathon
18.0%
Percent of middle school students
(2021)
Compared to:
Prior Value
(17.0%)
Prior Value compares a measured value with the previously measured value. Confidence intervals were taken into account in determining the direction of the comparison.
Teen - Self-Harm (Middle School) County: Marathon
Teen - Self-Harm (Middle School) County: Marathon
22.0%
Percent of middle school students
(2021)
Compared to:

Prior Value
(15.0%)
Prior Value compares a measured value with the previously measured value. Confidence intervals were taken into account in determining the direction of the comparison.
Teen Computer/Video Game Usage (Middle School) County: Marathon
Teen Computer/Video Game Usage (Middle School) County: Marathon
59.0%
Percent of middle school students
(2021)
Compared to:

Prior Value
(50.0%)
Prior Value compares a measured value with the previously measured value. Confidence intervals were not taken into account in determining the direction of the comparison.
Teen Seatbelt Use (Middle School) County: Marathon
Teen Seatbelt Use (Middle School) County: Marathon
92.0%
Percent of middle school students
(2021)
Compared to:
Prior Value
(92.0%)
Prior Value compares a measured value with the previously measured value. Confidence intervals were taken into account in determining the direction of the comparison.
Teen Sleep (Middle School) County: Marathon
Teen Sleep (Middle School) County: Marathon
54.0%
Percent of middle school students
(2021)
Compared to:
Prior Value
(55.0%)
Prior Value compares a measured value with the previously measured value. Confidence intervals were taken into account in determining the direction of the comparison.
Teens Bullied on School Property (Middle School) County: Marathon
Teens Bullied on School Property (Middle School) County: Marathon
22.0%
Percent of middle school students
(2021)
Compared to:
Prior Value
(28.0%)
Prior Value compares a measured value with the previously measured value. Confidence intervals were taken into account in determining the direction of the comparison.
Teens Who Feel They Belong at School (Middle School) County: Marathon
Teens Who Feel They Belong at School (Middle School) County: Marathon
70.0%
Percent of middle school students
(2021)
Compared to:
Prior Value
(72.0%)
Prior Value compares a measured value with the previously measured value. Confidence intervals were taken into account in determining the direction of the comparison.
Health / Adolescent Health
Teens Who Get Help and Support from Family (Middle School)
Value
Compared to:
Teens Who Get Help and Support from Family (Middle School) County: Marathon
Teens Who Get Help and Support from Family (Middle School) County: Marathon
80.0%
Percent of middle school students
(2021)
Compared to:

Prior Value
(86.0%)
Prior Value compares a measured value with the previously measured value. Confidence intervals were taken into account in determining the direction of the comparison.
Teens Who Had Sexual Intercourse (Middle School) County: Marathon
Teens Who Had Sexual Intercourse (Middle School) County: Marathon
3.0%
Percent of middle school students
(2021)
Compared to:
Prior Value
(3.0%)
Prior Value compares a measured value with the previously measured value. Confidence intervals were taken into account in determining the direction of the comparison.
Teens Who Have an Adult to Talk to (Middle School) County: Marathon
Teens Who Have an Adult to Talk to (Middle School) County: Marathon
67.0%
Percent of middle school students
(2021)
Compared to:

Prior Value
(73.0%)
Prior Value compares a measured value with the previously measured value. Confidence intervals were taken into account in determining the direction of the comparison.
Health / Adolescent Health
Teens Who Have Ever Been Forced To Do Anything Sexual (Middle School)
Value
Compared to:
Teens Who Have Ever Been Forced To Do Anything Sexual (Middle School) County: Marathon
Teens Who Have Ever Been Forced To Do Anything Sexual (Middle School) County: Marathon
7.0%
Percent of middle school students
(2021)
Compared to:
Prior Value
(5.0%)
Prior Value compares a measured value with the previously measured value. Confidence intervals were taken into account in determining the direction of the comparison.
Health / Adolescent Health
Teens Who Missed School Due to Safety Concerns (Middle School)
Value
Compared to:
Teens Who Missed School Due to Safety Concerns (Middle School) County: Marathon
Teens Who Missed School Due to Safety Concerns (Middle School) County: Marathon
8.0%
Percent of middle school students
(2021)
Compared to:
Prior Value
(8.0%)
Prior Value compares a measured value with the previously measured value. Confidence intervals were taken into account in determining the direction of the comparison.
Health / Adolescent Health
Teens Who Smoked Cigars, Cigarillos, or Little Cigars (Middle School)
Value
Compared to:
Teens Who Smoked Cigars, Cigarillos, or Little Cigars (Middle School) County: Marathon
Teens Who Smoked Cigars, Cigarillos, or Little Cigars (Middle School) County: Marathon
0.0%
Percent of middle school students
(2021)
Compared to:
Prior Value
(1.0%)
Prior Value compares a measured value with the previously measured value. Confidence intervals were taken into account in determining the direction of the comparison.
Health / Alcohol & Drug Use
Alcohol - Past 30-day use - Middle School County: Marathon
Alcohol - Past 30-day use - Middle School County: Marathon
7.0%
Percent of middle school students
(2021)
Compared to:
Prior Value
(8.0%)
Prior Value compares a measured value with the previously measured value. Confidence intervals were taken into account in determining the direction of the comparison.
Health / Alcohol & Drug Use
Teens - Ever Used Over-the-Counter Drug to Get High (Middle School)
Value
Compared to:
Teens - Ever Used Over-the-Counter Drug to Get High (Middle School) County: Marathon
Teens - Ever Used Over-the-Counter Drug to Get High (Middle School) County: Marathon
2.0%
Percent of middle school students
(2021)
Compared to:
Prior Value
(2.0%)
Prior Value compares a measured value with the previously measured value. Confidence intervals were not taken into account in determining the direction of the comparison.
Health / Alcohol & Drug Use
Teens - Ever Used Prescription Drugs without a Prescription (Middle School)
Value
Compared to:
Teens - Ever Used Prescription Drugs without a Prescription (Middle School) County: Marathon
Teens - Ever Used Prescription Drugs without a Prescription (Middle School) County: Marathon
4.0%
Percent of middle school students
(2021)
Compared to:
Prior Value
(3.0%)
Prior Value compares a measured value with the previously measured value. Confidence intervals were taken into account in determining the direction of the comparison.
Health / Alcohol & Drug Use
Teens Offered or Sold Drugs at School (Middle School)
Value
Compared to:
Teens Offered or Sold Drugs at School (Middle School) County: Marathon
Teens Offered or Sold Drugs at School (Middle School) County: Marathon
2.0%
Percent of middle school students
(2021)
Compared to:
Prior Value
(4.0%)
Prior Value compares a measured value with the previously measured value. Confidence intervals were taken into account in determining the direction of the comparison.
Health / Alcohol & Drug Use
Teens Who Used Any Illegal Drug Besides Marijuana (Middle School)
Value
Compared to:
Teens Who Used Any Illegal Drug Besides Marijuana (Middle School) County: Marathon
Teens Who Used Any Illegal Drug Besides Marijuana (Middle School) County: Marathon
1.0
(2021)
Compared to:
Prior Value
(1.0)
Prior Value compares a measured value with the previously measured value. Confidence intervals were taken into account in determining the direction of the comparison.
Health / Alcohol & Drug Use
Teens Who Used Marijuana in the Past 30-days (Middle School)
Value
Compared to:
Teens Who Used Marijuana in the Past 30-days (Middle School) County: Marathon
Teens Who Used Marijuana in the Past 30-days (Middle School) County: Marathon
1.0%
Percent of middle school students
(2021)
Compared to:
Prior Value
(2.0%)
Prior Value compares a measured value with the previously measured value. Confidence intervals were taken into account in determining the direction of the comparison.
Health / Mental Health & Mental Disorders
Teen Suicide Attempts (Middle School) County: Marathon
Teen Suicide Attempts (Middle School) County: Marathon
5.0%
Percent of middle school students
(2021)
Compared to:
Prior Value
(4.0%)
Prior Value compares a measured value with the previously measured value. Confidence intervals were taken into account in determining the direction of the comparison.
Health / Mental Health & Mental Disorders
Teens Who Considered Suicide (Middle School)
Value
Compared to:
Teens Who Considered Suicide (Middle School) County: Marathon
Teens Who Considered Suicide (Middle School) County: Marathon
17.0%
Percent of middle school students
(2021)
Compared to:
Prior Value
(13.0%)
Prior Value compares a measured value with the previously measured value. Confidence intervals were taken into account in determining the direction of the comparison.
Health / Mental Health & Mental Disorders
Teens Who Get Emotional Support When Needed (Middle School)
Value
Compared to:
Teens Who Get Emotional Support When Needed (Middle School) County: Marathon
Teens Who Get Emotional Support When Needed (Middle School) County: Marathon
38.0%
Percentage of middle school students
(2021)
Compared to:
Prior Value
(42.0%)
Prior Value compares a measured value with the previously measured value. Confidence intervals were taken into account in determining the direction of the comparison.
Health / Mental Health & Mental Disorders
Teens Who Reported Feeling Depressed (Middle School)
Value
Compared to:
Teens Who Reported Feeling Depressed (Middle School) County: Marathon
Teens Who Reported Feeling Depressed (Middle School) County: Marathon
27.0%
Percent of middle school students
(2021)
Compared to:
Prior Value
(23.0%)
Prior Value compares a measured value with the previously measured value. Confidence intervals were taken into account in determining the direction of the comparison.
Health / Mental Health & Mental Disorders
Teens Who Talk To An Adult For Emotional Support (Middle School)
Value
Compared to:
Teens Who Talk To An Adult For Emotional Support (Middle School) County: Marathon
Teens Who Talk To An Adult For Emotional Support (Middle School) County: Marathon
43.0%
Percentage of middle school students
(2021)
Compared to:
Prior Value
(47.0%)
Prior Value compares a measured value with the previously measured value. Confidence intervals were taken into account in determining the direction of the comparison.
Health / Mental Health & Mental Disorders
Teens with Anxiety Problems (Middle School)
Value
Compared to:
Teens with Anxiety Problems (Middle School) County: Marathon
Teens with Anxiety Problems (Middle School) County: Marathon
48.0%
(2021)
Compared to:
Prior Value
(45.0%)
Prior Value compares a measured value with the previously measured value. Confidence intervals were taken into account in determining the direction of the comparison.
Health / Mental Health & Mental Disorders
Teens with Suicide Plans (Middle School)
Value
Compared to:
Teens with Suicide Plans (Middle School) County: Marathon
Teens with Suicide Plans (Middle School) County: Marathon
12.0%
Percent of middle school students
(2021)
Compared to:
Prior Value
(9.0%)
Prior Value compares a measured value with the previously measured value. Confidence intervals were taken into account in determining the direction of the comparison.
Health / Nutrition & Healthy Eating
Teens Who Ate Breakfast (Middle School) County: Marathon
Teens Who Ate Breakfast (Middle School) County: Marathon
35.0%
Percent of middle school students
(2021)
Compared to:
Prior Value
(42.0%)
Prior Value compares a measured value with the previously measured value. Confidence intervals were taken into account in determining the direction of the comparison.
Health / Physical Activity
Teen Bike Helmet Usage (Middle School) County: Marathon
Teen Bike Helmet Usage (Middle School) County: Marathon
28.0%
Percent of middle school students
(2021)
Compared to:
Prior Value
(34.0%)
Prior Value compares a measured value with the previously measured value. Confidence intervals were taken into account in determining the direction of the comparison.
Teen Physical Activity (Middle School) County: Marathon
Teen Physical Activity (Middle School) County: Marathon
72.0%
Percent of middle school students
(2021)
Compared to:
Prior Value
(68.0%)
Prior Value compares a measured value with the previously measured value. Confidence intervals were taken into account in determining the direction of the comparison.
Health / Tobacco Use
Health / Tobacco Use
Teens Who Chewed Tobacco in the Past 30-days (Middle School)
Value
Compared to:
Teens Who Chewed Tobacco in the Past 30-days (Middle School) County: Marathon
Teens Who Chewed Tobacco in the Past 30-days (Middle School) County: Marathon
1.0%
Percent of middle school students
(2021)
Compared to:
Prior Value
(1.0%)
Prior Value compares a measured value with the previously measured value. Confidence intervals were taken into account in determining the direction of the comparison.
Teens Who Currently Vape (Middle School) County: Marathon
Teens Who Currently Vape (Middle School) County: Marathon
3.0%
Percent of middle school students
(2021)
Compared to:
Prior Value
(5.0%)
Prior Value compares a measured value with the previously measured value. Confidence intervals were taken into account in determining the direction of the comparison.
Health / Tobacco Use
Teens Who Smoked Cigarettes In the Past 30-days (Middle School)
Value
Compared to:
Teens Who Smoked Cigarettes In the Past 30-days (Middle School) County: Marathon
Teens Who Smoked Cigarettes In the Past 30-days (Middle School) County: Marathon
1.0%
Percent of middle school students
(2021)
Compared to:
Prior Value
(2.0%)
Prior Value compares a measured value with the previously measured value. Confidence intervals were taken into account in determining the direction of the comparison.
Community / Neighborhood/Community Attachment
Community / Neighborhood/Community Attachment
Teens Who Lived In 4 Or More Residences (Middle School)
Value
Compared to:
Teens Who Lived In 4 Or More Residences (Middle School) County: Marathon
Teens Who Lived In 4 Or More Residences (Middle School) County: Marathon
28.0%
Percent of middle school students
(2021)
Compared to:
Prior Value
(27.0%)
Prior Value compares a measured value with the previously measured value. Confidence intervals were taken into account in determining the direction of the comparison.
Community / Social Environment
Community / Social Environment
Teen - Carried A Weapon on School Property (Middle School)
Value
Compared to:
Teen - Carried A Weapon on School Property (Middle School) County: Marathon
Teen - Carried A Weapon on School Property (Middle School) County: Marathon
3.0%
Percent of middle school students
(2021)
Compared to:
Prior Value
(3.0%)
Prior Value compares a measured value with the previously measured value. Confidence intervals were taken into account in determining the direction of the comparison.
Teen - Physical Fight at School (Middle School) County: Marathon
Teen - Physical Fight at School (Middle School) County: Marathon
15.0%
Percent of middle school students
(2021)
Compared to:
Prior Value
(17.0%)
Prior Value compares a measured value with the previously measured value. Confidence intervals were taken into account in determining the direction of the comparison.
Community / Social Environment
Teens Who Say Teachers Care About Them (Middle School)
Value
Compared to:
Teens Who Say Teachers Care About Them (Middle School) County: Marathon
Teens Who Say Teachers Care About Them (Middle School) County: Marathon
66.0%
Percent of middle school students
(2021)
Compared to:
Prior Value
(72.0%)
Prior Value compares a measured value with the previously measured value. Confidence intervals were taken into account in determining the direction of the comparison.
Community / Teen & Adolescent Social Environment
Community / Teen & Adolescent Social Environment
Teens Who Participate in School Activities, Teams, or Clubs (Middle School)
Value
Compared to:
Teens Who Participate in School Activities, Teams, or Clubs (Middle School) County: Marathon
Teens Who Participate in School Activities, Teams, or Clubs (Middle School) County: Marathon
70.0%
Percent of middle school students
(2021)
Compared to:
Prior Value
(76.0%)
Prior Value compares a measured value with the previously measured value. Confidence intervals were taken into account in determining the direction of the comparison.
Community / Teen & Adolescent Social Environment
Teens Who Sent, Received or Shared Sexual Photos or Images (Middle School)
Value
Compared to:
Teens Who Sent, Received or Shared Sexual Photos or Images (Middle School) County: Marathon
Teens Who Sent, Received or Shared Sexual Photos or Images (Middle School) County: Marathon
5.0%
Percent of middle school students
(2021)
Compared to:
Prior Value
(4.0%)
Prior Value compares a measured value with the previously measured value. Confidence intervals were taken into account in determining the direction of the comparison.
Community / Teen & Adolescent Social Environment
Teens Who Use Technology After Midnight On A School Night (Middle School)
Value
Compared to:
Teens Who Use Technology After Midnight On A School Night (Middle School) County: Marathon
Teens Who Use Technology After Midnight On A School Night (Middle School) County: Marathon
38.0%
Percent of middle school students
(2021)
Compared to:
Prior Value
(37.0%)
Prior Value compares a measured value with the previously measured value. Confidence intervals were taken into account in determining the direction of the comparison.
Education / School Environment
Teens Who Felt Safe at School (Middle School) County: Marathon
Teens Who Felt Safe at School (Middle School) County: Marathon
81.0%
Percent of middle school students
(2021)
Compared to:
Prior Value
(82.0%)
Prior Value compares a measured value with the previously measured value. Confidence intervals were taken into account in determining the direction of the comparison.
