
Search for Indicators
All Data
Indicator Gauge Icon Legend
Legend Colors
Red is bad, green is good, blue is not statistically different/neutral.
Compared to Distribution
 the value is in the best half of communities.
 the value is in the 2nd worst quarter of communities.
 the value is in the worst quarter of communities.
Compared to Target
 meets target;
  does not meet target.
Compared to a Single Value
 lower than the comparison value;
 higher than the comparison value;
 not statistically different from comparison value.
Trend

 non-significant change over time;
 significant change over time;
  no change over time.
Compared to Prior Value
 higher than the previous measurement period;
 lower than the previous measurement period;
 no statistically different change from previous measurement period.
County: Marathon
Health / Immunizations & Infectious Diseases
Value
Compared to:
County: Marathon Flu Vaccinations: Medicare Population
County: Marathon Flu Vaccinations: Medicare Population
52.0%
(2022)
Compared to:
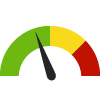


WI Counties
The distribution is based on data from 72 Wisconsin counties.
U.S. Counties
The distribution is based on data from 3,129 U.S. counties and county equivalents.
WI Value
(54.0%)
The regional value is compared to the Wisconsin State value.
US Value
(50.0%)
The regional value is compared to the national value.
Prior Value
(51.0%)
Prior Value compares a measured value with the previously measured value. Confidence intervals were not taken into account in determining the direction of the comparison.
Trend
This comparison measures the indicator’s values over multiple time periods.<br>The Mann-Kendall Test for Statistical Significance is used to evaluate the trend<br>over 4 to 10 periods of measure, subject to data availability and comparability.
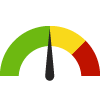
County: Marathon Lyme Disease Incidence Rate
County: Marathon Lyme Disease Incidence Rate
169.6
Cases per 100,000 population
(2022)
Compared to:


WI Counties
The distribution is based on data from 72 Wisconsin counties.
WI Value
(90.4)
The regional value is compared to the Wisconsin State value.
US Value
(18.8)
The regional value is compared to the national value. The source for the national value is Centers for Disease Control and Prevention
Prior Value
(33.4)
Prior Value compares a measured value with the previously measured value. Confidence intervals were not taken into account in determining the direction of the comparison.
Trend
This comparison measures the indicator’s values over multiple time periods.<br>The Mann-Kendall Test for Statistical Significance is used to evaluate the trend<br>over 4 to 10 periods of measure, subject to data availability and comparability.
County: Marathon Number of Childhood Vaccinations Completed by MCHD
County: Marathon Number of Childhood Vaccinations Completed by MCHD
240
Number
(2023)
Compared to:
Prior Value
(160)
Prior Value compares a measured value with the previously measured value. Confidence intervals were not taken into account in determining the direction of the comparison.
Trend
This comparison measures the indicator’s values over multiple time periods.<br>The Mann-Kendall Test for Statistical Significance is used to evaluate the trend<br>over 4 to 10 periods of measure, subject to data availability and comparability.
County: Marathon Number of Chlamydia Cases
County: Marathon Number of Chlamydia Cases
349
Number of cases
(2023)
Compared to:
Prior Value
(361)
Prior Value compares a measured value with the previously measured value. Confidence intervals were not taken into account in determining the direction of the comparison.
Trend
This comparison measures the indicator’s values over multiple time periods.<br>The Mann-Kendall Test for Statistical Significance is used to evaluate the trend<br>over 4 to 10 periods of measure, subject to data availability and comparability.
County: Marathon Number of Communicable Disease Reports in Marathon County
County: Marathon Number of Communicable Disease Reports in Marathon County
49,789
Number
(2022)
Compared to:
Prior Value
(52,965)
Prior Value compares a measured value with the previously measured value. Confidence intervals were not taken into account in determining the direction of the comparison.
7
Number
(2023)
Compared to:

Prior Value
(1)
Prior Value compares a measured value with the previously measured value. Confidence intervals were not taken into account in determining the direction of the comparison.
Trend
This comparison measures the indicator’s values over multiple time periods.<br>The Mann-Kendall Test for Statistical Significance is used to evaluate the trend<br>over 4 to 10 periods of measure, subject to data availability and comparability.
County: Marathon Number of Confirmed TB Cases in Marathon County
County: Marathon Number of Confirmed TB Cases in Marathon County
4
Number
(2023)
Compared to:
Prior Value
(3)
Prior Value compares a measured value with the previously measured value. Confidence intervals were not taken into account in determining the direction of the comparison.
Trend
This comparison measures the indicator’s values over multiple time periods.<br>The Mann-Kendall Test for Statistical Significance is used to evaluate the trend<br>over 4 to 10 periods of measure, subject to data availability and comparability.
County: Marathon Number of Gonorrhea Cases
County: Marathon Number of Gonorrhea Cases
62
Number of cases
(2022)
Compared to:

Prior Value
(90)
Prior Value compares a measured value with the previously measured value. Confidence intervals were not taken into account in determining the direction of the comparison.
Trend
This comparison measures the indicator’s values over multiple time periods.<br>The Mann-Kendall Test for Statistical Significance is used to evaluate the trend<br>over 4 to 10 periods of measure, subject to data availability and comparability.
County: Marathon Number of Hepatitis B Cases
County: Marathon Number of Hepatitis B Cases
8
Number of cases
(2022)
Compared to:
Prior Value
(8)
Prior Value compares a measured value with the previously measured value. Confidence intervals were not taken into account in determining the direction of the comparison.
Trend
This comparison measures the indicator’s values over multiple time periods.<br>The Mann-Kendall Test for Statistical Significance is used to evaluate the trend<br>over 4 to 10 periods of measure, subject to data availability and comparability.
County: Marathon Number of Hepatitis C Cases
County: Marathon Number of Hepatitis C Cases
48
Number of cases
(2023)
Compared to:
Prior Value
(33)
Prior Value compares a measured value with the previously measured value. Confidence intervals were not taken into account in determining the direction of the comparison.
Trend
This comparison measures the indicator’s values over multiple time periods.<br>The Mann-Kendall Test for Statistical Significance is used to evaluate the trend<br>over 4 to 10 periods of measure, subject to data availability and comparability.
County: Marathon Number of Individuals Screened for TB through MCHD
County: Marathon Number of Individuals Screened for TB through MCHD
90
Number
(2023)
Compared to:
Prior Value
(75)
Prior Value compares a measured value with the previously measured value. Confidence intervals were not taken into account in determining the direction of the comparison.
Trend
This comparison measures the indicator’s values over multiple time periods.<br>The Mann-Kendall Test for Statistical Significance is used to evaluate the trend<br>over 4 to 10 periods of measure, subject to data availability and comparability.
County: Marathon Number of Individuals Who Completed Infectious TB Treatment
County: Marathon Number of Individuals Who Completed Infectious TB Treatment
3
Number
(2022)
Compared to:
Prior Value
Prior Value compares a measured value with the previously measured value. Confidence intervals were not taken into account in determining the direction of the comparison.
County: Marathon Number of Pertussis (Whooping Cough) Cases
County: Marathon Number of Pertussis (Whooping Cough) Cases
0
Number of cases
(2022)
Compared to:
Prior Value
(5)
Prior Value compares a measured value with the previously measured value. Confidence intervals were not taken into account in determining the direction of the comparison.
Trend
This comparison measures the indicator’s values over multiple time periods.<br>The Mann-Kendall Test for Statistical Significance is used to evaluate the trend<br>over 4 to 10 periods of measure, subject to data availability and comparability.
County: Marathon Number of Successful Incident Resolutions
County: Marathon Number of Successful Incident Resolutions
1,659
Number
(2022)
Compared to:

Prior Value
(2,222)
Prior Value compares a measured value with the previously measured value. Confidence intervals were not taken into account in determining the direction of the comparison.
County: Marathon Number of Syphilis Cases
County: Marathon Number of Syphilis Cases
10
Number of cases
(2022)
Compared to:
Prior Value
(5)
Prior Value compares a measured value with the previously measured value. Confidence intervals were not taken into account in determining the direction of the comparison.
Trend
This comparison measures the indicator’s values over multiple time periods.<br>The Mann-Kendall Test for Statistical Significance is used to evaluate the trend<br>over 4 to 10 periods of measure, subject to data availability and comparability.
County: Marathon Percent of Individuals Who Completed TB Treatment
County: Marathon Percent of Individuals Who Completed TB Treatment
90.0%
(2023)
Compared to:
Prior Value
(78.0%)
Prior Value compares a measured value with the previously measured value. Confidence intervals were not taken into account in determining the direction of the comparison.
Trend
This comparison measures the indicator’s values over multiple time periods.<br>The Mann-Kendall Test for Statistical Significance is used to evaluate the trend<br>over 4 to 10 periods of measure, subject to data availability and comparability.
County: Marathon Persons Fully Vaccinated Against COVID-19
County: Marathon Persons Fully Vaccinated Against COVID-19
62.3%
(May 10, 2023)
Compared to:
WI Counties
The distribution is based on data from 72 Wisconsin counties.
U.S. Counties
The distribution is based on data from 3,125 U.S. counties and county equivalents.
Prior Value
(62.3%)
Prior Value compares a measured value with the previously measured value. Confidence intervals were not taken into account in determining the direction of the comparison.
Trend
This comparison measures the indicator’s values over multiple time periods.<br>The Mann-Kendall Test for Statistical Significance is used to evaluate the trend<br>over 4 to 10 periods of measure, subject to data availability and comparability.
County: Marathon Pneumonia Vaccinations: Medicare Population
County: Marathon Pneumonia Vaccinations: Medicare Population
7.0%
(2022)
Compared to:

WI Counties
The distribution is based on data from 72 Wisconsin counties.
U.S. Counties
The distribution is based on data from 3,129 U.S. counties and county equivalents.
WI Value
(7.0%)
The regional value is compared to the Wisconsin State value.
US Value
(8.0%)
The regional value is compared to the national value.
Prior Value
(6.0%)
Prior Value compares a measured value with the previously measured value. Confidence intervals were not taken into account in determining the direction of the comparison.
Trend
This comparison measures the indicator’s values over multiple time periods.<br>The Mann-Kendall Test for Statistical Significance is used to evaluate the trend<br>over 4 to 10 periods of measure, subject to data availability and comparability.
County: Marathon
Health / Maternal, Fetal & Infant Health
Value
Compared to:
County: Marathon Babies with Low Birthweight
County: Marathon Babies with Low Birthweight
8.2%
(2022)
Compared to:

WI Counties
The distribution is based on data from 68 Wisconsin counties.
WI Value
(8.0%)
The regional value is compared to the Wisconsin State value.
US Value
(8.5% in 2021)
The regional value is compared to the national value. The source for the national value is Centers for Disease Control and Prevention
Prior Value
(6.0%)
Prior Value compares a measured value with the previously measured value. Confidence intervals were taken into account in determining the direction of the comparison.
Trend
This comparison measures the indicator’s values over multiple time periods.<br>The Mann-Kendall Test for Statistical Significance is used to evaluate the trend<br>over 4 to 10 periods of measure, subject to data availability and comparability.
County: Marathon Babies with Very Low Birthweight
County: Marathon Babies with Very Low Birthweight
1.1%
(2022)
Compared to:
WI Value
(1.3%)
The regional value is compared to the Wisconsin State value.
US Value
(1.4% in 2021)
The regional value is compared to the national value. The source for the national value is Centers for Disease Control and Prevention
Prior Value
(1.1%)
Prior Value compares a measured value with the previously measured value. Confidence intervals were taken into account in determining the direction of the comparison.
Trend
This comparison measures the indicator’s values over multiple time periods.<br>The Mann-Kendall Test for Statistical Significance is used to evaluate the trend<br>over 4 to 10 periods of measure, subject to data availability and comparability.
County: Marathon Infant Mortality Rate
County: Marathon Infant Mortality Rate
6.1
Deaths per 1,000 live births
(2020-2022)
Compared to:

WI Counties
The distribution is based on data from 68 Wisconsin counties.
WI Value
(5.6)
The regional value is compared to the Wisconsin State value.
US Value
(5.4 in 2021)
The regional value is compared to the national value. The source for the national value is Centers for Disease Control and Prevention
Prior Value
(4.4)
Prior Value compares a measured value with the previously measured value. Confidence intervals were taken into account in determining the direction of the comparison.
Trend
This comparison measures the indicator’s values over multiple time periods.<br>The Mann-Kendall Test for Statistical Significance is used to evaluate the trend<br>over 4 to 10 periods of measure, subject to data availability and comparability.
HP 2030 Target
(5.0)
<div>MICH-02: Reduce the rate of infant deaths <strong>(LEADING HEALTH INDICATOR)</strong></div>
County: Marathon Mothers who Received Early Prenatal Care
County: Marathon Mothers who Received Early Prenatal Care
76.1%
(2022)
Compared to:
WI Counties
The distribution is based on data from 72 Wisconsin counties.
WI Value
(78.0%)
The regional value is compared to the Wisconsin State value.
US Value
(78.3% in 2021)
The regional value is compared to the national value. The source for the national value is Centers for Disease Control and Prevention
Prior Value
(71.8%)
Prior Value compares a measured value with the previously measured value. Confidence intervals were taken into account in determining the direction of the comparison.
Trend
This comparison measures the indicator’s values over multiple time periods.<br>The Mann-Kendall Test for Statistical Significance is used to evaluate the trend<br>over 4 to 10 periods of measure, subject to data availability and comparability.
County: Marathon Mothers who Smoked During Pregnancy
County: Marathon Mothers who Smoked During Pregnancy
6.0%
(2022)
Compared to:
WI Counties
The distribution is based on data from 71 Wisconsin counties.
WI Value
(5.4%)
The regional value is compared to the Wisconsin State value.
US Value
(4.6% in 2021)
The regional value is compared to the national value. The source for the national value is Centers for Disease Control and Prevention
Prior Value
(9.2%)
Prior Value compares a measured value with the previously measured value. Confidence intervals were not taken into account in determining the direction of the comparison.
Trend
This comparison measures the indicator’s values over multiple time periods.<br>The Mann-Kendall Test for Statistical Significance is used to evaluate the trend<br>over 4 to 10 periods of measure, subject to data availability and comparability.
HP 2030 Target
(4.3%)
County: Marathon Preterm Births
County: Marathon Preterm Births
11.0%
(2022)
Compared to:
WI Counties
The distribution is based on data from 71 Wisconsin counties.
WI Value
(10.2%)
The regional value is compared to the Wisconsin State value.
US Value
(10.5% in 2021)
The regional value is compared to the national value. The source for the national value is Centers for Disease Control and Prevention
Prior Value
(10.3%)
Prior Value compares a measured value with the previously measured value. Confidence intervals were taken into account in determining the direction of the comparison.
Trend
This comparison measures the indicator’s values over multiple time periods.<br>The Mann-Kendall Test for Statistical Significance is used to evaluate the trend<br>over 4 to 10 periods of measure, subject to data availability and comparability.
HP 2030 Target
(9.4%)
County: Marathon
Health / Medications & Prescriptions
Value
Compared to:
County: Marathon Number of Medication Drop Boxes in Marathon County
County: Marathon Number of Medication Drop Boxes in Marathon County
17
Number
(2023)
Compared to:
Prior Value
(17)
Prior Value compares a measured value with the previously measured value. Confidence intervals were not taken into account in determining the direction of the comparison.
Trend
This comparison measures the indicator’s values over multiple time periods.<br>The Mann-Kendall Test for Statistical Significance is used to evaluate the trend<br>over 4 to 10 periods of measure, subject to data availability and comparability.
2,077
Pounds
(2023)
Compared to:

Prior Value
(1,368)
Prior Value compares a measured value with the previously measured value. Confidence intervals were not taken into account in determining the direction of the comparison.
Trend
This comparison measures the indicator’s values over multiple time periods.<br>The Mann-Kendall Test for Statistical Significance is used to evaluate the trend<br>over 4 to 10 periods of measure, subject to data availability and comparability.
County: Marathon
Health / Men's Health
Value
Compared to:
County: Marathon Emergency Department Visits for Self-Harm Injuries
County: Marathon Emergency Department Visits for Self-Harm Injuries
92
(2021)
Compared to:
Prior Value
(111)
Prior Value compares a measured value with the previously measured value. Confidence intervals were not taken into account in determining the direction of the comparison.
Trend
This comparison measures the indicator’s values over multiple time periods.<br>The Mann-Kendall Test for Statistical Significance is used to evaluate the trend<br>over 4 to 10 periods of measure, subject to data availability and comparability.
County: Marathon Hospitalizations for Self-Harm Injuries
County: Marathon Hospitalizations for Self-Harm Injuries
70
(2021)
Compared to:
Prior Value
(78)
Prior Value compares a measured value with the previously measured value. Confidence intervals were not taken into account in determining the direction of the comparison.
Trend
This comparison measures the indicator’s values over multiple time periods.<br>The Mann-Kendall Test for Statistical Significance is used to evaluate the trend<br>over 4 to 10 periods of measure, subject to data availability and comparability.
County: Marathon
Health / Mental Health & Mental Disorders
Value
Compared to:
County: Marathon Adults Ever Diagnosed with Depression
County: Marathon Adults Ever Diagnosed with Depression
22.2%
(2021)
Compared to:
WI Counties
The distribution is based on data from 72 Wisconsin counties.
U.S. Counties
The distribution is based on data from 3,074 U.S. counties and county equivalents.
US Value
(19.5%)
The regional value is compared to the national value.
County: Marathon Age-Adjusted Death Rate due to Suicide
County: Marathon Age-Adjusted Death Rate due to Suicide
13.2
Deaths per 100,000 population
(2020-2022)
Compared to:
WI Counties
The distribution is based on data from 68 Wisconsin counties.
WI Value
(14.8)
The regional value is compared to the Wisconsin State value.
US Value
(13.5 in 2020)
The regional value is compared to the national value. The source for the national value is Centers for Disease Control and Prevention
Prior Value
(15.0)
Prior Value compares a measured value with the previously measured value. Confidence intervals were taken into account in determining the direction of the comparison.
Trend
This comparison measures the indicator’s values over multiple time periods.<br>The Mann-Kendall Test for Statistical Significance is used to evaluate the trend<br>over 4 to 10 periods of measure, subject to data availability and comparability.
HP 2030 Target
(12.8)
<div>MHMD-01: Reduce the suicide rate <strong>(LEADING HEALTH INDICATOR)</strong></div>
County: Marathon Depression: Medicare Population
County: Marathon Depression: Medicare Population
14.0%
(2022)
Compared to:
WI Counties
The distribution is based on data from 72 Wisconsin counties.
U.S. Counties
The distribution is based on data from 3,129 U.S. counties and county equivalents.
WI Value
(16.0%)
The regional value is compared to the Wisconsin State value.
US Value
(16.0%)
The regional value is compared to the national value.
Prior Value
(14.0%)
Prior Value compares a measured value with the previously measured value. Confidence intervals were not taken into account in determining the direction of the comparison.
Trend
This comparison measures the indicator’s values over multiple time periods.<br>The Mann-Kendall Test for Statistical Significance is used to evaluate the trend<br>over 4 to 10 periods of measure, subject to data availability and comparability.
County: Marathon Frequent Mental Distress
County: Marathon Frequent Mental Distress
13.5%
(2019)
Compared to:
WI Counties
The distribution is based on data from 72 Wisconsin counties.
U.S. Counties
The distribution is based on data from 3,121 U.S. counties and county equivalents.
WI Value
(13.5%)
The regional value is compared to the Wisconsin State value.
US Value
(14.0%)
The regional value is compared to the national value.
Prior Value
(12.8%)
Prior Value compares a measured value with the previously measured value. Confidence intervals were taken into account in determining the direction of the comparison.
County: Marathon Households that Received Mental Healthcare Services
County: Marathon Households that Received Mental Healthcare Services
7.6%
(2023)
Compared to:

WI Value
(8.2%)
The regional value is compared to the Wisconsin State value.
US Value
(8.8%)
The regional value is compared to the national value.
Prior Value
(7.0%)
Prior Value compares a measured value with the previously measured value. Confidence intervals were not taken into account in determining the direction of the comparison.
Trend
This comparison measures the indicator’s values over multiple time periods.<br>The Mann-Kendall Test for Statistical Significance is used to evaluate the trend<br>over 4 to 10 periods of measure, subject to data availability and comparability.
County: Marathon Marathon County Residents That Didn't Go to a Mental Health Provider
County: Marathon Marathon County Residents That Didn't Go to a Mental Health Provider
23%
(2022)
Compared to:
Prior Value
(18%)
Prior Value compares a measured value with the previously measured value. Confidence intervals were not taken into account in determining the direction of the comparison.
Trend
This comparison measures the indicator’s values over multiple time periods.<br>The Mann-Kendall Test for Statistical Significance is used to evaluate the trend<br>over 4 to 10 periods of measure, subject to data availability and comparability.
County: Marathon Mental Health Provider Rate
County: Marathon Mental Health Provider Rate
226
Providers per 100,000 population
(2023)
Compared to:

WI Counties
The distribution is based on data from 72 Wisconsin counties.
U.S. Counties
The distribution is based on data from 2,956 U.S. counties and county equivalents.
WI Value
(251)
The regional value is compared to the Wisconsin State value.
Prior Value
(217)
Prior Value compares a measured value with the previously measured value. Confidence intervals were not taken into account in determining the direction of the comparison.
Trend
This comparison measures the indicator’s values over multiple time periods.<br>The Mann-Kendall Test for Statistical Significance is used to evaluate the trend<br>over 4 to 10 periods of measure, subject to data availability and comparability.
County: Marathon Number of Emergency Detentions
County: Marathon Number of Emergency Detentions
266
Number of emergency detentions
(2022)
Compared to:
Prior Value
(354)
Prior Value compares a measured value with the previously measured value. Confidence intervals were not taken into account in determining the direction of the comparison.
Trend
This comparison measures the indicator’s values over multiple time periods.<br>The Mann-Kendall Test for Statistical Significance is used to evaluate the trend<br>over 4 to 10 periods of measure, subject to data availability and comparability.
County: Marathon Poor Mental Health: 14+ Days
County: Marathon Poor Mental Health: 14+ Days
13.3%
(2021)
Compared to:
WI Counties
The distribution is based on data from 72 Wisconsin counties.
U.S. Counties
The distribution is based on data from 3,074 U.S. counties and county equivalents.
US Value
(14.7%)
The regional value is compared to the national value.
County: Marathon Poor Mental Health: Average Number of Days
County: Marathon Poor Mental Health: Average Number of Days
4.6
Days
(2021)
Compared to:
WI Counties
The distribution is based on data from 72 Wisconsin counties.
U.S. Counties
The distribution is based on data from 3,141 U.S. counties and county equivalents.
WI Value
(4.8)
The regional value is compared to the Wisconsin State value.
US Value
(4.8)
The regional value is compared to the national value.
Prior Value
(4.7)
Prior Value compares a measured value with the previously measured value. Confidence intervals were taken into account in determining the direction of the comparison.
Trend
This comparison measures the indicator’s values over multiple time periods.<br>The Mann-Kendall Test for Statistical Significance is used to evaluate the trend<br>over 4 to 10 periods of measure, subject to data availability and comparability.
County: Marathon Suicide Deaths
County: Marathon Suicide Deaths
22
(2022)
Compared to:
Prior Value
(21)
Prior Value compares a measured value with the previously measured value. Confidence intervals were not taken into account in determining the direction of the comparison.
Trend
This comparison measures the indicator’s values over multiple time periods.<br>The Mann-Kendall Test for Statistical Significance is used to evaluate the trend<br>over 4 to 10 periods of measure, subject to data availability and comparability.
County: Marathon Teen - Self-Harm (High School)
County: Marathon Teen - Self-Harm (High School)
19.0%
Percent of high school students
(2021)
Compared to:
WI Value
(21.7%)
The regional value is compared to the Wisconsin State value.
Prior Value
(16.0%)
Prior Value compares a measured value with the previously measured value. Confidence intervals were taken into account in determining the direction of the comparison.
Trend
This comparison measures the indicator’s values over multiple time periods.<br>The Mann-Kendall Test for Statistical Significance is used to evaluate the trend<br>over 4 to 10 periods of measure, subject to data availability and comparability.
County: Marathon Teen Suicide Attempts (High School)
County: Marathon Teen Suicide Attempts (High School)
7.0%
Percent of high school students
(2021)
Compared to:
WI Value
(8.5%)
The regional value is compared to the Wisconsin State value.
US Value
(10.0%)
The regional value is compared to the national value.
Prior Value
(7.0%)
Prior Value compares a measured value with the previously measured value. Confidence intervals were taken into account in determining the direction of the comparison.
Trend
This comparison measures the indicator’s values over multiple time periods.<br>The Mann-Kendall Test for Statistical Significance is used to evaluate the trend<br>over 4 to 10 periods of measure, subject to data availability and comparability.
County: Marathon Teen Suicide Attempts (Middle School)
County: Marathon Teen Suicide Attempts (Middle School)
5.0%
Percent of middle school students
(2021)
Compared to:
Prior Value
(4.0%)
Prior Value compares a measured value with the previously measured value. Confidence intervals were taken into account in determining the direction of the comparison.
County: Marathon Teens Who Considered Suicide (High School)
County: Marathon Teens Who Considered Suicide (High School)
16.0%
Percent of high school students
(2021)
Compared to:
WI Value
(18.1%)
The regional value is compared to the Wisconsin State value.
US Value
(22.0%)
The regional value is compared to the national value.
Prior Value
(15.0%)
Prior Value compares a measured value with the previously measured value. Confidence intervals were taken into account in determining the direction of the comparison.
Trend
This comparison measures the indicator’s values over multiple time periods.<br>The Mann-Kendall Test for Statistical Significance is used to evaluate the trend<br>over 4 to 10 periods of measure, subject to data availability and comparability.
County: Marathon Teens Who Considered Suicide (Middle School)
County: Marathon Teens Who Considered Suicide (Middle School)
17.0%
Percent of middle school students
(2021)
Compared to:
Prior Value
(13.0%)
Prior Value compares a measured value with the previously measured value. Confidence intervals were taken into account in determining the direction of the comparison.
County: Marathon Teens Who Get Emotional Support When Needed (High School)
County: Marathon Teens Who Get Emotional Support When Needed (High School)
21.0%
Percentage of high school students
(2021)
Compared to:
Prior Value
(23.0%)
Prior Value compares a measured value with the previously measured value. Confidence intervals were taken into account in determining the direction of the comparison.
County: Marathon Teens Who Get Emotional Support When Needed (Middle School)
County: Marathon Teens Who Get Emotional Support When Needed (Middle School)
38.0%
Percentage of middle school students
(2021)
Compared to:
Prior Value
(42.0%)
Prior Value compares a measured value with the previously measured value. Confidence intervals were taken into account in determining the direction of the comparison.
County: Marathon Teens Who Have an Adult to Talk to (High School)
County: Marathon Teens Who Have an Adult to Talk to (High School)
69.0%
Percent of high school students
(2021)
Compared to:
WI Value
(67.1%)
The regional value is compared to the Wisconsin State value.
Prior Value
(74.0%)
Prior Value compares a measured value with the previously measured value. Confidence intervals were taken into account in determining the direction of the comparison.
Trend
This comparison measures the indicator’s values over multiple time periods.<br>The Mann-Kendall Test for Statistical Significance is used to evaluate the trend<br>over 4 to 10 periods of measure, subject to data availability and comparability.
83.0%
Percentage of high school students
(2021)
Compared to:
WI Value
(82.4%)
The regional value is compared to the Wisconsin State value.
Prior Value
(86.0%)
Prior Value compares a measured value with the previously measured value. Confidence intervals were taken into account in determining the direction of the comparison.
County: Marathon Teens Who Reported Feeling Depressed (High School)
County: Marathon Teens Who Reported Feeling Depressed (High School)
29.0%
Percent of high school students
(2021)
Compared to:
WI Value
(33.7%)
The regional value is compared to the Wisconsin State value.
US Value
(42.0%)
The regional value is compared to the national value.
Prior Value
(26.0%)
Prior Value compares a measured value with the previously measured value. Confidence intervals were taken into account in determining the direction of the comparison.
Trend
This comparison measures the indicator’s values over multiple time periods.<br>The Mann-Kendall Test for Statistical Significance is used to evaluate the trend<br>over 4 to 10 periods of measure, subject to data availability and comparability.
County: Marathon Teens Who Reported Feeling Depressed (Middle School)
County: Marathon Teens Who Reported Feeling Depressed (Middle School)
27.0%
Percent of middle school students
(2021)
Compared to:
Prior Value
(23.0%)
Prior Value compares a measured value with the previously measured value. Confidence intervals were taken into account in determining the direction of the comparison.
County: Marathon Teens Who Talk To An Adult For Emotional Support (High School)
County: Marathon Teens Who Talk To An Adult For Emotional Support (High School)
30.0%
Percentage of high school students
(2021)
Compared to:
WI Value
(23.6%)
The regional value is compared to the Wisconsin State value.
Prior Value
(34.0%)
Prior Value compares a measured value with the previously measured value. Confidence intervals were taken into account in determining the direction of the comparison.
County: Marathon Teens Who Talk To An Adult For Emotional Support (Middle School)
County: Marathon Teens Who Talk To An Adult For Emotional Support (Middle School)
43.0%
Percentage of middle school students
(2021)
Compared to:
Prior Value
(47.0%)
Prior Value compares a measured value with the previously measured value. Confidence intervals were taken into account in determining the direction of the comparison.
County: Marathon Teens with Anxiety Problems (High School)
County: Marathon Teens with Anxiety Problems (High School)
45.0%
(2021)
Compared to:
WI Value
(52.2%)
The regional value is compared to the Wisconsin State value.
Prior Value
(43.0%)
Prior Value compares a measured value with the previously measured value. Confidence intervals were not taken into account in determining the direction of the comparison.
County: Marathon Teens with Anxiety Problems (Middle School)
County: Marathon Teens with Anxiety Problems (Middle School)
48.0%
(2021)
Compared to:
Prior Value
(45.0%)
Prior Value compares a measured value with the previously measured value. Confidence intervals were taken into account in determining the direction of the comparison.
County: Marathon Teens with Suicide Plans (High School)
County: Marathon Teens with Suicide Plans (High School)
13.0%
Percent of high school students
(2021)
Compared to:
WI Value
(14.8%)
The regional value is compared to the Wisconsin State value.
US Value
(18.0%)
The regional value is compared to the national value.
Prior Value
(11.0%)
Prior Value compares a measured value with the previously measured value. Confidence intervals were taken into account in determining the direction of the comparison.
Trend
This comparison measures the indicator’s values over multiple time periods.<br>The Mann-Kendall Test for Statistical Significance is used to evaluate the trend<br>over 4 to 10 periods of measure, subject to data availability and comparability.
County: Marathon Teens with Suicide Plans (Middle School)
County: Marathon Teens with Suicide Plans (Middle School)
12.0%
Percent of middle school students
(2021)
Compared to:
Prior Value
(9.0%)
Prior Value compares a measured value with the previously measured value. Confidence intervals were taken into account in determining the direction of the comparison.
County: Marathon
Health / Mortality Data
Value
Compared to:
County: Marathon Life Expectancy
County: Marathon Life Expectancy
79.1
Years
(2019-2021)
Compared to:
WI Counties
The distribution is based on data from 72 Wisconsin counties.
U.S. Counties
The distribution is based on data from 3,070 U.S. counties and county equivalents.
WI Value
(78.2)
The regional value is compared to the Wisconsin State value.
US Value
(77.6)
The regional value is compared to the national value.
County: Marathon Number of Deaths due to Falls
County: Marathon Number of Deaths due to Falls
48
Number
(2022)
Compared to:
Prior Value
(30)
Prior Value compares a measured value with the previously measured value. Confidence intervals were not taken into account in determining the direction of the comparison.
Trend
This comparison measures the indicator’s values over multiple time periods.<br>The Mann-Kendall Test for Statistical Significance is used to evaluate the trend<br>over 4 to 10 periods of measure, subject to data availability and comparability.
County: Marathon Number of Emergency Department Visits due to Falls
County: Marathon Number of Emergency Department Visits due to Falls
2,293
Number
(2022)
Compared to:
Prior Value
(2,273)
Prior Value compares a measured value with the previously measured value. Confidence intervals were not taken into account in determining the direction of the comparison.
Trend
This comparison measures the indicator’s values over multiple time periods.<br>The Mann-Kendall Test for Statistical Significance is used to evaluate the trend<br>over 4 to 10 periods of measure, subject to data availability and comparability.
County: Marathon Number of Hospitalizations due to Falls
County: Marathon Number of Hospitalizations due to Falls
355
Number
(2022)
Compared to:
Prior Value
(341)
Prior Value compares a measured value with the previously measured value. Confidence intervals were not taken into account in determining the direction of the comparison.
Trend
This comparison measures the indicator’s values over multiple time periods.<br>The Mann-Kendall Test for Statistical Significance is used to evaluate the trend<br>over 4 to 10 periods of measure, subject to data availability and comparability.
County: Marathon Premature Death
County: Marathon Premature Death
6,326.8
Years per 100,000 population
(2019-2021)
Compared to:
WI Counties
The distribution is based on data from 70 Wisconsin counties.
U.S. Counties
The distribution is based on data from 2,886 U.S. counties and county equivalents.
WI Value
(7,082.4)
The regional value is compared to the Wisconsin State value.
US Value
(7,971.5)
The regional value is compared to the national value.
County: Marathon Suicide Death Review Team (SDRT) Prevention Recommendations
County: Marathon Suicide Death Review Team (SDRT) Prevention Recommendations
8
(2023)
Compared to:

Prior Value
(49)
Prior Value compares a measured value with the previously measured value. Confidence intervals were not taken into account in determining the direction of the comparison.
County: Marathon
Health / Nutrition & Healthy Eating
Value
Compared to:
County: Marathon Adults who Drank Soft Drinks: Past 7 Days
County: Marathon Adults who Drank Soft Drinks: Past 7 Days
44.7%
(2023)
Compared to:
WI Counties
The distribution is based on data from 72 Wisconsin counties.
WI Value
(44.2%)
The regional value is compared to the Wisconsin State value.
US Value
(43.7%)
The regional value is compared to the national value.
County: Marathon Adults Who Frequently Used Quick Service Restaurants: Past 30 Days
County: Marathon Adults Who Frequently Used Quick Service Restaurants: Past 30 Days
39.1%
(2023)
Compared to:
WI Counties
The distribution is based on data from 72 Wisconsin counties.
U.S. Counties
The distribution is based on data from 3,141 U.S. counties and county equivalents.
WI Value
(39.3%)
The regional value is compared to the Wisconsin State value.
US Value
(40.4%)
The regional value is compared to the national value.
Prior Value
(39.8%)
Prior Value compares a measured value with the previously measured value. Confidence intervals were not taken into account in determining the direction of the comparison.
Trend
This comparison measures the indicator’s values over multiple time periods.<br>The Mann-Kendall Test for Statistical Significance is used to evaluate the trend<br>over 4 to 10 periods of measure, subject to data availability and comparability.
County: Marathon Family Mealtime
County: Marathon Family Mealtime
58%
(2022)
Compared to:
Prior Value
(63%)
Prior Value compares a measured value with the previously measured value. Confidence intervals were not taken into account in determining the direction of the comparison.
Trend
This comparison measures the indicator’s values over multiple time periods.<br>The Mann-Kendall Test for Statistical Significance is used to evaluate the trend<br>over 4 to 10 periods of measure, subject to data availability and comparability.
County: Marathon Teen Fruit Consumption (High School)
County: Marathon Teen Fruit Consumption (High School)
43.0%
Percent of high school students
(2021)
Compared to:

Prior Value
(44.0%)
Prior Value compares a measured value with the previously measured value. Confidence intervals were not taken into account in determining the direction of the comparison.
Trend
This comparison measures the indicator’s values over multiple time periods.<br>The Mann-Kendall Test for Statistical Significance is used to evaluate the trend<br>over 4 to 10 periods of measure, subject to data availability and comparability.
County: Marathon Teen Vegetable Consumption (High School)
County: Marathon Teen Vegetable Consumption (High School)
42.0%
Percent of high school students
(2021)
Compared to:

WI Value
(38.2%)
The regional value is compared to the Wisconsin State value.
Prior Value
(43.0%)
Prior Value compares a measured value with the previously measured value. Confidence intervals were taken into account in determining the direction of the comparison.
Trend
This comparison measures the indicator’s values over multiple time periods.<br>The Mann-Kendall Test for Statistical Significance is used to evaluate the trend<br>over 4 to 10 periods of measure, subject to data availability and comparability.
County: Marathon Teens Who Ate Breakfast (High School)
County: Marathon Teens Who Ate Breakfast (High School)
30.0%
Percent of high school students
(2021)
Compared to:
WI Value
(27.1%)
The regional value is compared to the Wisconsin State value.
Prior Value
(34.0%)
Prior Value compares a measured value with the previously measured value. Confidence intervals were taken into account in determining the direction of the comparison.
Trend
This comparison measures the indicator’s values over multiple time periods.<br>The Mann-Kendall Test for Statistical Significance is used to evaluate the trend<br>over 4 to 10 periods of measure, subject to data availability and comparability.
County: Marathon Teens Who Ate Breakfast (Middle School)
County: Marathon Teens Who Ate Breakfast (Middle School)
35.0%
Percent of middle school students
(2021)
Compared to:
Prior Value
(42.0%)
Prior Value compares a measured value with the previously measured value. Confidence intervals were taken into account in determining the direction of the comparison.
County: Marathon Teens Who Drank Water Every Day (High School)
County: Marathon Teens Who Drank Water Every Day (High School)
80.0%
Percentage of high school students
(2021)
Compared to:
WI Value
(77.4%)
The regional value is compared to the Wisconsin State value.
Prior Value
(77.0%)
Prior Value compares a measured value with the previously measured value. Confidence intervals were taken into account in determining the direction of the comparison.
County: Marathon
Health / Older Adults
Value
Compared to:
County: Marathon Adults 65+ who Received Recommended Preventive Services: Females
County: Marathon Adults 65+ who Received Recommended Preventive Services: Females
33.3%
(2020)
Compared to:
WI Counties
The distribution is based on data from 72 Wisconsin counties.
U.S. Counties
The distribution is based on data from 3,141 U.S. counties and county equivalents.
US Value
(37.9%)
The regional value is compared to the national value.
County: Marathon Adults 65+ who Received Recommended Preventive Services: Males
County: Marathon Adults 65+ who Received Recommended Preventive Services: Males
38.1%
(2020)
Compared to:
WI Counties
The distribution is based on data from 72 Wisconsin counties.
U.S. Counties
The distribution is based on data from 3,141 U.S. counties and county equivalents.
US Value
(43.7%)
The regional value is compared to the national value.
County: Marathon Adults 65+ with a Disability
County: Marathon Adults 65+ with a Disability
30.5%
(2018-2022)
Compared to:

WI Value
(29.2%)
The regional value is compared to the Wisconsin State value.
US Value
(33.3%)
The regional value is compared to the national value.
Trend
This comparison measures the indicator’s values over multiple time periods.<br>The Mann-Kendall Test for Statistical Significance is used to evaluate the trend<br>over 4 to 10 periods of measure, subject to data availability and comparability.
County: Marathon Adults 65+ with a Hearing Difficulty
County: Marathon Adults 65+ with a Hearing Difficulty
12.7%
(2018-2022)
Compared to:

WI Value
(13.0%)
The regional value is compared to the Wisconsin State value.
US Value
(13.7%)
The regional value is compared to the national value.
Trend
This comparison measures the indicator’s values over multiple time periods.<br>The Mann-Kendall Test for Statistical Significance is used to evaluate the trend<br>over 4 to 10 periods of measure, subject to data availability and comparability.
County: Marathon Adults 65+ with a Self-Care Difficulty
County: Marathon Adults 65+ with a Self-Care Difficulty
6.8%
(2018-2022)
Compared to:
WI Value
(5.5%)
The regional value is compared to the Wisconsin State value.
US Value
(7.4%)
The regional value is compared to the national value.
Trend
This comparison measures the indicator’s values over multiple time periods.<br>The Mann-Kendall Test for Statistical Significance is used to evaluate the trend<br>over 4 to 10 periods of measure, subject to data availability and comparability.
County: Marathon Adults 65+ with a Vision Difficulty
County: Marathon Adults 65+ with a Vision Difficulty
3.8%
(2018-2022)
Compared to:
WI Value
(4.5%)
The regional value is compared to the Wisconsin State value.
US Value
(6.0%)
The regional value is compared to the national value.
Trend
This comparison measures the indicator’s values over multiple time periods.<br>The Mann-Kendall Test for Statistical Significance is used to evaluate the trend<br>over 4 to 10 periods of measure, subject to data availability and comparability.
County: Marathon Adults 65+ with an Independent Living Difficulty
County: Marathon Adults 65+ with an Independent Living Difficulty
12.6%
(2018-2022)
Compared to:
WI Value
(10.4%)
The regional value is compared to the Wisconsin State value.
US Value
(13.6%)
The regional value is compared to the national value.
Trend
This comparison measures the indicator’s values over multiple time periods.<br>The Mann-Kendall Test for Statistical Significance is used to evaluate the trend<br>over 4 to 10 periods of measure, subject to data availability and comparability.
County: Marathon Age-Adjusted Death Rate due to Alzheimer's Disease
County: Marathon Age-Adjusted Death Rate due to Alzheimer's Disease
27.6
Deaths per 100,000 population
(2020-2022)
Compared to:
WI Counties
The distribution is based on data from 69 Wisconsin counties.
WI Value
(31.6)
The regional value is compared to the Wisconsin State value.
US Value
(32.4 in 2020)
The regional value is compared to the national value. The source for the national value is Centers for Disease Control and Prevention
Prior Value
(31.4)
Prior Value compares a measured value with the previously measured value. Confidence intervals were taken into account in determining the direction of the comparison.
Trend
This comparison measures the indicator’s values over multiple time periods.<br>The Mann-Kendall Test for Statistical Significance is used to evaluate the trend<br>over 4 to 10 periods of measure, subject to data availability and comparability.
County: Marathon Alzheimer's Disease or Dementia: Medicare Population
County: Marathon Alzheimer's Disease or Dementia: Medicare Population
5.0%
(2022)
Compared to:

WI Counties
The distribution is based on data from 72 Wisconsin counties.
U.S. Counties
The distribution is based on data from 3,129 U.S. counties and county equivalents.
WI Value
(5.0%)
The regional value is compared to the Wisconsin State value.
US Value
(6.0%)
The regional value is compared to the national value.
Prior Value
(5.0%)
Prior Value compares a measured value with the previously measured value. Confidence intervals were not taken into account in determining the direction of the comparison.
Trend
This comparison measures the indicator’s values over multiple time periods.<br>The Mann-Kendall Test for Statistical Significance is used to evaluate the trend<br>over 4 to 10 periods of measure, subject to data availability and comparability.
County: Marathon Number of Fall-Related EMS Calls (Age 60+)
County: Marathon Number of Fall-Related EMS Calls (Age 60+)
2,383
(2023)
Compared to:
Prior Value
(2,389)
Prior Value compares a measured value with the previously measured value. Confidence intervals were not taken into account in determining the direction of the comparison.
Trend
This comparison measures the indicator’s values over multiple time periods.<br>The Mann-Kendall Test for Statistical Significance is used to evaluate the trend<br>over 4 to 10 periods of measure, subject to data availability and comparability.
County: Marathon
Health / Oral Health
Value
Compared to:
County: Marathon Adults 65+ with Total Tooth Loss
County: Marathon Adults 65+ with Total Tooth Loss
9.0%
(2020)
Compared to:
WI Counties
The distribution is based on data from 72 Wisconsin counties.
U.S. Counties
The distribution is based on data from 3,141 U.S. counties and county equivalents.
US Value
(13.4%)
The regional value is compared to the national value.
County: Marathon Adults who Visited a Dentist
County: Marathon Adults who Visited a Dentist
69.4%
(2020)
Compared to:
WI Counties
The distribution is based on data from 72 Wisconsin counties.
U.S. Counties
The distribution is based on data from 3,141 U.S. counties and county equivalents.
US Value
(64.8%)
The regional value is compared to the national value.
County: Marathon Dentist Rate
County: Marathon Dentist Rate
75
Dentists per 100,000 population
(2022)
Compared to:
WI Counties
The distribution is based on data from 72 Wisconsin counties.
U.S. Counties
The distribution is based on data from 3,054 U.S. counties and county equivalents.
WI Value
(73)
The regional value is compared to the Wisconsin State value.
Prior Value
(76)
Prior Value compares a measured value with the previously measured value. Confidence intervals were not taken into account in determining the direction of the comparison.
Trend
This comparison measures the indicator’s values over multiple time periods.<br>The Mann-Kendall Test for Statistical Significance is used to evaluate the trend<br>over 4 to 10 periods of measure, subject to data availability and comparability.
County: Marathon Marathon County Residents That Didn't Go to the Dentist
County: Marathon Marathon County Residents That Didn't Go to the Dentist
34%
(2022)
Compared to:
Prior Value
(35%)
Prior Value compares a measured value with the previously measured value. Confidence intervals were not taken into account in determining the direction of the comparison.
Trend
This comparison measures the indicator’s values over multiple time periods.<br>The Mann-Kendall Test for Statistical Significance is used to evaluate the trend<br>over 4 to 10 periods of measure, subject to data availability and comparability.
County: Marathon No Recent Dental Visit
County: Marathon No Recent Dental Visit
29.0%
(2017)
Compared to:
WI Counties
The distribution is based on data from 72 Wisconsin counties.
WI Value
(26.0%)
The regional value is compared to the Wisconsin State value.
Prior Value
(27.0%)
Prior Value compares a measured value with the previously measured value. Confidence intervals were taken into account in determining the direction of the comparison.
Trend
This comparison measures the indicator’s values over multiple time periods.<br>The Mann-Kendall Test for Statistical Significance is used to evaluate the trend<br>over 4 to 10 periods of measure, subject to data availability and comparability.
County: Marathon Non-Traumatic Oral Health Emergency Department Visit Rate
County: Marathon Non-Traumatic Oral Health Emergency Department Visit Rate
31.8
ED visits per 10,000 population
(2022)
Compared to:
WI Counties
The distribution is based on data from 72 Wisconsin counties.
WI Value
(36.2)
The regional value is compared to the Wisconsin State value.
Prior Value
(29.6)
Prior Value compares a measured value with the previously measured value. Confidence intervals were not taken into account in determining the direction of the comparison.
Trend
This comparison measures the indicator’s values over multiple time periods.<br>The Mann-Kendall Test for Statistical Significance is used to evaluate the trend<br>over 4 to 10 periods of measure, subject to data availability and comparability.
County: Marathon Students Referred to a Dentist for Treatment
County: Marathon Students Referred to a Dentist for Treatment
50.1%
Percent of students
(2022-2023)
Compared to:
Prior Value
(41.7%)
Prior Value compares a measured value with the previously measured value. Confidence intervals were not taken into account in determining the direction of the comparison.
Trend
This comparison measures the indicator’s values over multiple time periods.<br>The Mann-Kendall Test for Statistical Significance is used to evaluate the trend<br>over 4 to 10 periods of measure, subject to data availability and comparability.
County: Marathon Students Referred to a Dentist with Urgent or Emergent Needs
County: Marathon Students Referred to a Dentist with Urgent or Emergent Needs
72.7%
Percent of students
(2022-2023)
Compared to:
Prior Value
(84.5%)
Prior Value compares a measured value with the previously measured value. Confidence intervals were not taken into account in determining the direction of the comparison.
Trend
This comparison measures the indicator’s values over multiple time periods.<br>The Mann-Kendall Test for Statistical Significance is used to evaluate the trend<br>over 4 to 10 periods of measure, subject to data availability and comparability.
County: Marathon
Health / Other Conditions
Value
Compared to:
County: Marathon Adults with Arthritis
County: Marathon Adults with Arthritis
27.8%
(2021)
Compared to:
WI Counties
The distribution is based on data from 72 Wisconsin counties.
U.S. Counties
The distribution is based on data from 3,074 U.S. counties and county equivalents.
US Value
(25.2%)
The regional value is compared to the national value.
County: Marathon Adults with Kidney Disease
County: Marathon Adults with Kidney Disease
3.1%
(2021)
Compared to:
WI Counties
The distribution is based on data from 72 Wisconsin counties.
U.S. Counties
The distribution is based on data from 3,074 U.S. counties and county equivalents.
US Value
(3.1%)
The regional value is compared to the national value.
County: Marathon Age-Adjusted Death Rate due to Kidney Disease
County: Marathon Age-Adjusted Death Rate due to Kidney Disease
13.8
Deaths per 100,000 population
(2018-2020)
Compared to:
WI Counties
The distribution is based on data from 36 Wisconsin counties.
U.S. Counties
The distribution is based on data from 1,416 U.S. counties and county equivalents.
WI Value
(11.9)
The regional value is compared to the Wisconsin State value.
US Value
(12.8)
The regional value is compared to the national value.
Prior Value
(15.3)
Prior Value compares a measured value with the previously measured value. Confidence intervals were taken into account in determining the direction of the comparison.
Trend
This comparison measures the indicator’s values over multiple time periods.<br>The Mann-Kendall Test for Statistical Significance is used to evaluate the trend<br>over 4 to 10 periods of measure, subject to data availability and comparability.
County: Marathon Chronic Kidney Disease: Medicare Population
County: Marathon Chronic Kidney Disease: Medicare Population
19.0%
(2022)
Compared to:
WI Counties
The distribution is based on data from 72 Wisconsin counties.
U.S. Counties
The distribution is based on data from 3,129 U.S. counties and county equivalents.
WI Value
(19.0%)
The regional value is compared to the Wisconsin State value.
US Value
(18.0%)
The regional value is compared to the national value.
Prior Value
(18.0%)
Prior Value compares a measured value with the previously measured value. Confidence intervals were not taken into account in determining the direction of the comparison.
Trend
This comparison measures the indicator’s values over multiple time periods.<br>The Mann-Kendall Test for Statistical Significance is used to evaluate the trend<br>over 4 to 10 periods of measure, subject to data availability and comparability.
County: Marathon Osteoporosis: Medicare Population
County: Marathon Osteoporosis: Medicare Population
9.0%
(2022)
Compared to:
WI Counties
The distribution is based on data from 72 Wisconsin counties.
U.S. Counties
The distribution is based on data from 3,129 U.S. counties and county equivalents.
WI Value
(10.0%)
The regional value is compared to the Wisconsin State value.
US Value
(11.0%)
The regional value is compared to the national value.
Prior Value
(9.0%)
Prior Value compares a measured value with the previously measured value. Confidence intervals were not taken into account in determining the direction of the comparison.
Trend
This comparison measures the indicator’s values over multiple time periods.<br>The Mann-Kendall Test for Statistical Significance is used to evaluate the trend<br>over 4 to 10 periods of measure, subject to data availability and comparability.
County: Marathon Rheumatoid Arthritis or Osteoarthritis: Medicare Population
County: Marathon Rheumatoid Arthritis or Osteoarthritis: Medicare Population
28.0%
(2022)
Compared to:
WI Counties
The distribution is based on data from 72 Wisconsin counties.
U.S. Counties
The distribution is based on data from 3,129 U.S. counties and county equivalents.
WI Value
(30.0%)
The regional value is compared to the Wisconsin State value.
US Value
(35.0%)
The regional value is compared to the national value.
Prior Value
(28.0%)
Prior Value compares a measured value with the previously measured value. Confidence intervals were not taken into account in determining the direction of the comparison.
Trend
This comparison measures the indicator’s values over multiple time periods.<br>The Mann-Kendall Test for Statistical Significance is used to evaluate the trend<br>over 4 to 10 periods of measure, subject to data availability and comparability.
County: Marathon
Health / Physical Activity
Value
Compared to:
County: Marathon Adults who are Sedentary
County: Marathon Adults who are Sedentary
22.0%
(2020-2022)
Compared to:
WI Counties
The distribution is based on data from 57 Wisconsin counties.
WI Value
(20.2%)
The regional value is compared to the Wisconsin State value.
Prior Value
(22.5%)
Prior Value compares a measured value with the previously measured value. Confidence intervals were taken into account in determining the direction of the comparison.
Trend
This comparison measures the indicator’s values over multiple time periods.<br>The Mann-Kendall Test for Statistical Significance is used to evaluate the trend<br>over 4 to 10 periods of measure, subject to data availability and comparability.
HP 2030 Target
(21.8%)
County: Marathon Marathon County Residents Physical Activity
County: Marathon Marathon County Residents Physical Activity
56%
(2022)
Compared to:
Prior Value
(52%)
Prior Value compares a measured value with the previously measured value. Confidence intervals were not taken into account in determining the direction of the comparison.
Trend
This comparison measures the indicator’s values over multiple time periods.<br>The Mann-Kendall Test for Statistical Significance is used to evaluate the trend<br>over 4 to 10 periods of measure, subject to data availability and comparability.
County: Marathon Teen Bike Helmet Usage (Middle School)
County: Marathon Teen Bike Helmet Usage (Middle School)
28.0%
Percent of middle school students
(2021)
Compared to:
Prior Value
(34.0%)
Prior Value compares a measured value with the previously measured value. Confidence intervals were taken into account in determining the direction of the comparison.
County: Marathon Teen Physical Activity (High School)
County: Marathon Teen Physical Activity (High School)
67.0%
Percent of high school students
(2021)
Compared to:
WI Value
(52.6%)
The regional value is compared to the Wisconsin State value.
Prior Value
(62.0%)
Prior Value compares a measured value with the previously measured value. Confidence intervals were taken into account in determining the direction of the comparison.
Trend
This comparison measures the indicator’s values over multiple time periods.<br>The Mann-Kendall Test for Statistical Significance is used to evaluate the trend<br>over 4 to 10 periods of measure, subject to data availability and comparability.
County: Marathon Teen Physical Activity (Middle School)
County: Marathon Teen Physical Activity (Middle School)
72.0%
Percent of middle school students
(2021)
Compared to:
Prior Value
(68.0%)
Prior Value compares a measured value with the previously measured value. Confidence intervals were taken into account in determining the direction of the comparison.
County: Marathon
Health / Prevention & Safety
Value
Compared to:
County: Marathon Age-Adjusted Death Rate due to Falls
County: Marathon Age-Adjusted Death Rate due to Falls
20.0
Deaths per 100,000 population
(2020-2022)
Compared to:
WI Counties
The distribution is based on data from 68 Wisconsin counties.
WI Value
(24.5)
The regional value is compared to the Wisconsin State value.
US Value
(10.3 in 2020)
The regional value is compared to the national value. The source for the national value is Centers for Disease Control and Prevention
Prior Value
(16.6)
Prior Value compares a measured value with the previously measured value. Confidence intervals were taken into account in determining the direction of the comparison.
Trend
This comparison measures the indicator’s values over multiple time periods.<br>The Mann-Kendall Test for Statistical Significance is used to evaluate the trend<br>over 4 to 10 periods of measure, subject to data availability and comparability.
County: Marathon Age-Adjusted Death Rate due to Firearms
County: Marathon Age-Adjusted Death Rate due to Firearms
8.4
Deaths per 100,000 population
(2018-2020)
Compared to:
U.S. Counties
The distribution is based on data from 1,083 U.S. counties and county equivalents.
WI Value
(10.4)
The regional value is compared to the Wisconsin State value.
US Value
(12.0)
The regional value is compared to the national value.
Prior Value
(9.5)
Prior Value compares a measured value with the previously measured value. Confidence intervals were taken into account in determining the direction of the comparison.
Trend
This comparison measures the indicator’s values over multiple time periods.<br>The Mann-Kendall Test for Statistical Significance is used to evaluate the trend<br>over 4 to 10 periods of measure, subject to data availability and comparability.
HP 2030 Target
(10.7)
County: Marathon Age-Adjusted Death Rate due to Unintentional Injuries
County: Marathon Age-Adjusted Death Rate due to Unintentional Injuries
51.2
Deaths per 100,000 population
(2020-2022)
Compared to:
WI Counties
The distribution is based on data from 72 Wisconsin counties.
WI Value
(72.7)
The regional value is compared to the Wisconsin State value.
US Value
(57.6 in 2020)
The regional value is compared to the national value. The source for the national value is Centers for Disease Control and Prevention
Prior Value
(46.4)
Prior Value compares a measured value with the previously measured value. Confidence intervals were taken into account in determining the direction of the comparison.
Trend
This comparison measures the indicator’s values over multiple time periods.<br>The Mann-Kendall Test for Statistical Significance is used to evaluate the trend<br>over 4 to 10 periods of measure, subject to data availability and comparability.
HP 2030 Target
(43.2)
County: Marathon Age-Adjusted Death Rate due to Unintentional Poisonings
County: Marathon Age-Adjusted Death Rate due to Unintentional Poisonings
15.8
Deaths per 100,000 population
(2020-2022)
Compared to:
WI Counties
The distribution is based on data from 66 Wisconsin counties.
WI Value
(29.0)
The regional value is compared to the Wisconsin State value.
US Value
(28.3 in 2020)
The regional value is compared to the national value. The source for the national value is Centers for Disease Control and Prevention
Prior Value
(13.1)
Prior Value compares a measured value with the previously measured value. Confidence intervals were taken into account in determining the direction of the comparison.
Trend
This comparison measures the indicator’s values over multiple time periods.<br>The Mann-Kendall Test for Statistical Significance is used to evaluate the trend<br>over 4 to 10 periods of measure, subject to data availability and comparability.
County: Marathon Teen Condom Use (High School)
County: Marathon Teen Condom Use (High School)
60.0%
Percent of high school students
(2021)
Compared to:
WI Value
(59.0%)
The regional value is compared to the Wisconsin State value.
US Value
(52.0%)
The regional value is compared to the national value.
Prior Value
(61.0%)
Prior Value compares a measured value with the previously measured value. Confidence intervals were taken into account in determining the direction of the comparison.
Trend
This comparison measures the indicator’s values over multiple time periods.<br>The Mann-Kendall Test for Statistical Significance is used to evaluate the trend<br>over 4 to 10 periods of measure, subject to data availability and comparability.
County: Marathon Teen Seat belt Use (High School)
County: Marathon Teen Seat belt Use (High School)
91.0%
Percent of high school students
(2021)
Compared to:
WI Value
(86.7%)
The regional value is compared to the Wisconsin State value.
Prior Value
(90.0%)
Prior Value compares a measured value with the previously measured value. Confidence intervals were taken into account in determining the direction of the comparison.
Trend
This comparison measures the indicator’s values over multiple time periods.<br>The Mann-Kendall Test for Statistical Significance is used to evaluate the trend<br>over 4 to 10 periods of measure, subject to data availability and comparability.
County: Marathon Teens Who Have Ever Been Raped (High School)
County: Marathon Teens Who Have Ever Been Raped (High School)
6.0%
Percent of high school students
(2021)
Compared to:
WI Value
(9.2%)
The regional value is compared to the Wisconsin State value.
US Value
(8.0%)
The regional value is compared to the national value.
Prior Value
(6.0%)
Prior Value compares a measured value with the previously measured value. Confidence intervals were taken into account in determining the direction of the comparison.
22.0%
Percentage of high school students
(2021)
Compared to:
WI Value
(22.0%)
The regional value is compared to the Wisconsin State value.
US Value
(3.0%)
The regional value is compared to the national value.
Prior Value
(28.0%)
Prior Value compares a measured value with the previously measured value. Confidence intervals were taken into account in determining the direction of the comparison.
County: Marathon Teens Who Wear Sunscreen When Outside (High School)
County: Marathon Teens Who Wear Sunscreen When Outside (High School)
21.0%
Percentage of high school students
(2021)
Compared to:
WI Value
(20.5%)
The regional value is compared to the Wisconsin State value.
Prior Value
(21.0%)
Prior Value compares a measured value with the previously measured value. Confidence intervals were taken into account in determining the direction of the comparison.
County: Marathon
Health / Respiratory Diseases
Value
Compared to:
County: Marathon Adults with Asthma
County: Marathon Adults with Asthma
9.9%
(2019-2021)
Compared to:
WI Counties
The distribution is based on data from 49 Wisconsin counties.
WI Value
(10.4%)
The regional value is compared to the Wisconsin State value.
Prior Value
(9.6%)
Prior Value compares a measured value with the previously measured value. Confidence intervals were taken into account in determining the direction of the comparison.
Trend
This comparison measures the indicator’s values over multiple time periods.<br>The Mann-Kendall Test for Statistical Significance is used to evaluate the trend<br>over 4 to 10 periods of measure, subject to data availability and comparability.
County: Marathon Adults with COPD
County: Marathon Adults with COPD
6.1%
Percent of adults
(2021)
Compared to:
WI Counties
The distribution is based on data from 72 Wisconsin counties.
U.S. Counties
The distribution is based on data from 3,074 U.S. counties and county equivalents.
US Value
(6.4%)
The regional value is compared to the national value.
County: Marathon Adults with Current Asthma
County: Marathon Adults with Current Asthma
9.9%
(2021)
Compared to:
WI Counties
The distribution is based on data from 72 Wisconsin counties.
U.S. Counties
The distribution is based on data from 3,074 U.S. counties and county equivalents.
US Value
(9.7%)
The regional value is compared to the national value.
County: Marathon Age-Adjusted Death Rate due to Chronic Lower Respiratory Diseases
County: Marathon Age-Adjusted Death Rate due to Chronic Lower Respiratory Diseases
36.6
Deaths per 100,000 population
(2020-2022)
Compared to:
WI Counties
The distribution is based on data from 72 Wisconsin counties.
WI Value
(33.5)
The regional value is compared to the Wisconsin State value.
US Value
(36.4 in 2020)
The regional value is compared to the national value. The source for the national value is Centers for Disease Control and Prevention
Prior Value
(34.2)
Prior Value compares a measured value with the previously measured value. Confidence intervals were taken into account in determining the direction of the comparison.
Trend
This comparison measures the indicator’s values over multiple time periods.<br>The Mann-Kendall Test for Statistical Significance is used to evaluate the trend<br>over 4 to 10 periods of measure, subject to data availability and comparability.
County: Marathon Asthma: Medicare Population
County: Marathon Asthma: Medicare Population
5.0%
(2022)
Compared to:
WI Counties
The distribution is based on data from 72 Wisconsin counties.
U.S. Counties
The distribution is based on data from 3,129 U.S. counties and county equivalents.
WI Value
(6.0%)
The regional value is compared to the Wisconsin State value.
US Value
(7.0%)
The regional value is compared to the national value.
Prior Value
(5.0%)
Prior Value compares a measured value with the previously measured value. Confidence intervals were not taken into account in determining the direction of the comparison.
Trend
This comparison measures the indicator’s values over multiple time periods.<br>The Mann-Kendall Test for Statistical Significance is used to evaluate the trend<br>over 4 to 10 periods of measure, subject to data availability and comparability.
County: Marathon COPD: Medicare Population
County: Marathon COPD: Medicare Population
8.0%
(2022)
Compared to:
WI Counties
The distribution is based on data from 72 Wisconsin counties.
U.S. Counties
The distribution is based on data from 3,129 U.S. counties and county equivalents.
WI Value
(9.0%)
The regional value is compared to the Wisconsin State value.
US Value
(11.0%)
The regional value is compared to the national value.
Prior Value
(9.0%)
Prior Value compares a measured value with the previously measured value. Confidence intervals were not taken into account in determining the direction of the comparison.
Trend
This comparison measures the indicator’s values over multiple time periods.<br>The Mann-Kendall Test for Statistical Significance is used to evaluate the trend<br>over 4 to 10 periods of measure, subject to data availability and comparability.
County: Marathon Teens with Asthma
County: Marathon Teens with Asthma
19.0%
Percentage of high school students
(2019)
Compared to:
US Value
(22.5% in 2017)
The regional value is compared to the national value.
Prior Value
(20.5%)
Prior Value compares a measured value with the previously measured value. Confidence intervals were not taken into account in determining the direction of the comparison.
County: Marathon
Health / Sexually Transmitted Infections
Value
Compared to:
County: Marathon Chlamydia Incidence Rate
County: Marathon Chlamydia Incidence Rate
268
Cases per 100,000 population
(2022)
Compared to:
WI Counties
The distribution is based on data from 70 Wisconsin counties.
WI Value
(439)
The regional value is compared to the Wisconsin State value.
US Value
(495.0)
The regional value is compared to the national value. The source for the national value is National Center for HIV/AIDS, Viral Hepatitis, STD, and TB Prevention
Prior Value
(255)
Prior Value compares a measured value with the previously measured value. Confidence intervals were not taken into account in determining the direction of the comparison.
Trend
This comparison measures the indicator’s values over multiple time periods.<br>The Mann-Kendall Test for Statistical Significance is used to evaluate the trend<br>over 4 to 10 periods of measure, subject to data availability and comparability.
County: Marathon HIV Diagnosis Rate
County: Marathon HIV Diagnosis Rate
0.0
Cases per 100,000 population
(2019)
Compared to:
WI Value
(3.7)
The regional value is compared to the Wisconsin State value.
Prior Value
(1.5)
Prior Value compares a measured value with the previously measured value. Confidence intervals were not taken into account in determining the direction of the comparison.
Trend
This comparison measures the indicator’s values over multiple time periods.<br>The Mann-Kendall Test for Statistical Significance is used to evaluate the trend<br>over 4 to 10 periods of measure, subject to data availability and comparability.
County: Marathon HIV Prevalence Rate
County: Marathon HIV Prevalence Rate
62.0
Cases per 100,000 population
(2021)
Compared to:
WI Value
(136.6)
The regional value is compared to the Wisconsin State value.
US Value
(382.2)
The regional value is compared to the national value.
Prior Value
(57.9)
Prior Value compares a measured value with the previously measured value. Confidence intervals were not taken into account in determining the direction of the comparison.
Trend
This comparison measures the indicator’s values over multiple time periods.<br>The Mann-Kendall Test for Statistical Significance is used to evaluate the trend<br>over 4 to 10 periods of measure, subject to data availability and comparability.
County: Marathon Number of Hepatitis C Cases Diagnosed in Inmates
County: Marathon Number of Hepatitis C Cases Diagnosed in Inmates
4
Number
(2022)
Compared to:
Prior Value
Prior Value compares a measured value with the previously measured value. Confidence intervals were not taken into account in determining the direction of the comparison.
County: Marathon Number of Inmates Seen for STI Clinic Services in Jail
County: Marathon Number of Inmates Seen for STI Clinic Services in Jail
132
Number
(2023)
Compared to:
Prior Value
(81)
Prior Value compares a measured value with the previously measured value. Confidence intervals were not taken into account in determining the direction of the comparison.
Trend
This comparison measures the indicator’s values over multiple time periods.<br>The Mann-Kendall Test for Statistical Significance is used to evaluate the trend<br>over 4 to 10 periods of measure, subject to data availability and comparability.
County: Marathon Percent of Chlamydia Cases Diagnosed from Jail Screening
County: Marathon Percent of Chlamydia Cases Diagnosed from Jail Screening
1.7%
(2023)
Compared to:
Prior Value
(0.8%)
Prior Value compares a measured value with the previously measured value. Confidence intervals were not taken into account in determining the direction of the comparison.
Trend
This comparison measures the indicator’s values over multiple time periods.<br>The Mann-Kendall Test for Statistical Significance is used to evaluate the trend<br>over 4 to 10 periods of measure, subject to data availability and comparability.
County: Marathon Percent of Hepatitis C Cases Diagnosed from Jail Screening
County: Marathon Percent of Hepatitis C Cases Diagnosed from Jail Screening
1.7
(2023)
Compared to:
Prior Value
(0.8)
Prior Value compares a measured value with the previously measured value. Confidence intervals were not taken into account in determining the direction of the comparison.
Trend
This comparison measures the indicator’s values over multiple time periods.<br>The Mann-Kendall Test for Statistical Significance is used to evaluate the trend<br>over 4 to 10 periods of measure, subject to data availability and comparability.
County: Marathon
Health / Tobacco Use
Value
Compared to:
County: Marathon Adults Who Bought Medications to Quit Smoking
County: Marathon Adults Who Bought Medications to Quit Smoking
1.5%
(2023)
Compared to:
WI Value
(1.4%)
The regional value is compared to the Wisconsin State value.
US Value
(1.4%)
The regional value is compared to the national value.
Prior Value
(1.5%)
Prior Value compares a measured value with the previously measured value. Confidence intervals were not taken into account in determining the direction of the comparison.
Trend
This comparison measures the indicator’s values over multiple time periods.<br>The Mann-Kendall Test for Statistical Significance is used to evaluate the trend<br>over 4 to 10 periods of measure, subject to data availability and comparability.
County: Marathon Adults who Smoke
County: Marathon Adults who Smoke
16.0%
(2020-2022)
Compared to:
WI Counties
The distribution is based on data from 56 Wisconsin counties.
WI Value
(15.1%)
The regional value is compared to the Wisconsin State value.
Prior Value
(17.2%)
Prior Value compares a measured value with the previously measured value. Confidence intervals were taken into account in determining the direction of the comparison.
Trend
This comparison measures the indicator’s values over multiple time periods.<br>The Mann-Kendall Test for Statistical Significance is used to evaluate the trend<br>over 4 to 10 periods of measure, subject to data availability and comparability.
HP 2030 Target
(6.1%)
<div>TU-02: Reduce current cigarette smoking in adults <strong>(LEADING HEALTH INDICATOR)</strong></div>
County: Marathon Adults Who Used Electronic Cigarettes: Past 30 Days
County: Marathon Adults Who Used Electronic Cigarettes: Past 30 Days
5.7%
(2023)
Compared to:
WI Counties
The distribution is based on data from 72 Wisconsin counties.
U.S. Counties
The distribution is based on data from 3,141 U.S. counties and county equivalents.
WI Value
(5.7%)
The regional value is compared to the Wisconsin State value.
US Value
(5.9%)
The regional value is compared to the national value.
County: Marathon Adults Who Used Smokeless Tobacco: Past 30 Days
County: Marathon Adults Who Used Smokeless Tobacco: Past 30 Days
2.5%
(2023)
Compared to:
WI Counties
The distribution is based on data from 72 Wisconsin counties.
U.S. Counties
The distribution is based on data from 3,141 U.S. counties and county equivalents.
WI Value
(2.1%)
The regional value is compared to the Wisconsin State value.
US Value
(1.7%)
The regional value is compared to the national value.
Prior Value
(2.5%)
Prior Value compares a measured value with the previously measured value. Confidence intervals were not taken into account in determining the direction of the comparison.
Trend
This comparison measures the indicator’s values over multiple time periods.<br>The Mann-Kendall Test for Statistical Significance is used to evaluate the trend<br>over 4 to 10 periods of measure, subject to data availability and comparability.
County: Marathon Teen - Ever Tried Smoking Cigarettes (High School)
County: Marathon Teen - Ever Tried Smoking Cigarettes (High School)
15.0%
Percent of high school students
(2021)
Compared to:
WI Value
(16.8%)
The regional value is compared to the Wisconsin State value.
US Value
(28.9% in 2017)
The county value is compared to the national value.
Prior Value
(21.0%)
Prior Value compares a measured value with the previously measured value. Confidence intervals were taken into account in determining the direction of the comparison.
Trend
This comparison measures the indicator’s values over multiple time periods.<br>The Mann-Kendall Test for Statistical Significance is used to evaluate the trend<br>over 4 to 10 periods of measure, subject to data availability and comparability.
County: Marathon Teens Who Chewed Tobacco in the Past 30-days (High School)
County: Marathon Teens Who Chewed Tobacco in the Past 30-days (High School)
2.0%
Percent of high school students
(2021)
Compared to:
WI Value
(2.4%)
The regional value is compared to the Wisconsin State value.
US Value
(5.5% in 2017)
The county value is compared to the national value.
Prior Value
(5.0%)
Prior Value compares a measured value with the previously measured value. Confidence intervals were taken into account in determining the direction of the comparison.
Trend
This comparison measures the indicator’s values over multiple time periods.<br>The Mann-Kendall Test for Statistical Significance is used to evaluate the trend<br>over 4 to 10 periods of measure, subject to data availability and comparability.
County: Marathon Teens Who Chewed Tobacco in the Past 30-days (Middle School)
County: Marathon Teens Who Chewed Tobacco in the Past 30-days (Middle School)
1.0%
Percent of middle school students
(2021)
Compared to:
Prior Value
(1.0%)
Prior Value compares a measured value with the previously measured value. Confidence intervals were taken into account in determining the direction of the comparison.
County: Marathon Teens Who Currently Vape (Middle School)
County: Marathon Teens Who Currently Vape (Middle School)
3.0%
Percent of middle school students
(2021)
Compared to:
Prior Value
(5.0%)
Prior Value compares a measured value with the previously measured value. Confidence intervals were taken into account in determining the direction of the comparison.
County: Marathon Teens Who Have Ever Tried Vaping (High School)
County: Marathon Teens Who Have Ever Tried Vaping (High School)
24.0%
Percent of high school students
(2021)
Compared to:
WI Value
(32.4%)
The regional value is compared to the Wisconsin State value.
Prior Value
(37.0%)
Prior Value compares a measured value with the previously measured value. Confidence intervals were taken into account in determining the direction of the comparison.
County: Marathon Teens Who Smoked Cigarettes Before Age 13 (High School)
County: Marathon Teens Who Smoked Cigarettes Before Age 13 (High School)
37.0%
Percent of high school students
(2021)
Compared to:
WI Value
(40.0%)
The regional value is compared to the Wisconsin State value.
Prior Value
(30.0%)
Prior Value compares a measured value with the previously measured value. Confidence intervals were taken into account in determining the direction of the comparison.
County: Marathon Teens Who Smoked Cigarettes In the Past 30-days (High School)
County: Marathon Teens Who Smoked Cigarettes In the Past 30-days (High School)
4.0%
Percent of high school students
(2021)
Compared to:
WI Value
(4.5%)
The regional value is compared to the Wisconsin State value.
US Value
(8.8% in 2017)
The regional value is compared to the national value.
Prior Value
(7.0%)
Prior Value compares a measured value with the previously measured value. Confidence intervals were taken into account in determining the direction of the comparison.
Trend
This comparison measures the indicator’s values over multiple time periods.<br>The Mann-Kendall Test for Statistical Significance is used to evaluate the trend<br>over 4 to 10 periods of measure, subject to data availability and comparability.
County: Marathon Teens Who Smoked Cigarettes In the Past 30-days (Middle School)
County: Marathon Teens Who Smoked Cigarettes In the Past 30-days (Middle School)
1.0%
Percent of middle school students
(2021)
Compared to:
Prior Value
(2.0%)
Prior Value compares a measured value with the previously measured value. Confidence intervals were taken into account in determining the direction of the comparison.
County: Marathon Teens Who Smoked Cigars, Cigarillos, or Little Cigars (High School)
County: Marathon Teens Who Smoked Cigars, Cigarillos, or Little Cigars (High School)
2.0%
Percent of high school students
(2021)
Compared to:
WI Value
(2.4%)
The regional value is compared to the Wisconsin State value.
US Value
(8.0% in 2017)
The county value is compared to the national value.
Prior Value
(5.0%)
Prior Value compares a measured value with the previously measured value. Confidence intervals were taken into account in determining the direction of the comparison.
Trend
This comparison measures the indicator’s values over multiple time periods.<br>The Mann-Kendall Test for Statistical Significance is used to evaluate the trend<br>over 4 to 10 periods of measure, subject to data availability and comparability.
County: Marathon Teens Who Tried to Quit Smoking (High School)
County: Marathon Teens Who Tried to Quit Smoking (High School)
48.0%
Percent of high school students
(2021)
Compared to:
WI Value
(47.7%)
The regional value is compared to the Wisconsin State value.
US Value
(42.4% in 2017)
The county value is compared to the national value.
Prior Value
(42.0%)
Prior Value compares a measured value with the previously measured value. Confidence intervals were taken into account in determining the direction of the comparison.
Trend
This comparison measures the indicator’s values over multiple time periods.<br>The Mann-Kendall Test for Statistical Significance is used to evaluate the trend<br>over 4 to 10 periods of measure, subject to data availability and comparability.
11.0%
Percent of high school students
(2021)
Compared to:
WI Value
(14.7%)
The regional value is compared to the Wisconsin State value.
US Value
(18.0%)
The regional value is compared to the national value.
Prior Value
(16.0%)
Prior Value compares a measured value with the previously measured value. Confidence intervals were taken into account in determining the direction of the comparison.
County: Marathon
Health / Weight Status
Value
Compared to:
County: Marathon Adults Who Are Obese
County: Marathon Adults Who Are Obese
34.2%
(2020-2022)
Compared to:
WI Counties
The distribution is based on data from 57 Wisconsin counties.
WI Value
(31.5%)
The regional value is compared to the Wisconsin State value.
Prior Value
(33.8%)
Prior Value compares a measured value with the previously measured value. Confidence intervals were taken into account in determining the direction of the comparison.
Trend
This comparison measures the indicator’s values over multiple time periods.<br>The Mann-Kendall Test for Statistical Significance is used to evaluate the trend<br>over 4 to 10 periods of measure, subject to data availability and comparability.
County: Marathon Adults who are Overweight
County: Marathon Adults who are Overweight
29.7%
(2020-2022)
Compared to:
WI Counties
The distribution is based on data from 57 Wisconsin counties.
WI Value
(30.8%)
The regional value is compared to the Wisconsin State value.
US Value
(34.1% in 2022)
The regional value is compared to the national value. The source for the national value is Behavioral Risk Factor Surveillance System
Prior Value
(30.3%)
Prior Value compares a measured value with the previously measured value. Confidence intervals were taken into account in determining the direction of the comparison.
Trend
This comparison measures the indicator’s values over multiple time periods.<br>The Mann-Kendall Test for Statistical Significance is used to evaluate the trend<br>over 4 to 10 periods of measure, subject to data availability and comparability.
County: Marathon Marathon County Residents who are Overweight or Obese
County: Marathon Marathon County Residents who are Overweight or Obese
74%
(2022)
Compared to:
Prior Value
(72%)
Prior Value compares a measured value with the previously measured value. Confidence intervals were not taken into account in determining the direction of the comparison.
Trend
This comparison measures the indicator’s values over multiple time periods.<br>The Mann-Kendall Test for Statistical Significance is used to evaluate the trend<br>over 4 to 10 periods of measure, subject to data availability and comparability.
County: Marathon
Health / Wellness & Lifestyle
Value
Compared to:
County: Marathon Adults who Feel Life is Slipping Out of Control
County: Marathon Adults who Feel Life is Slipping Out of Control
25.6%
(2023)
Compared to:
WI Counties
The distribution is based on data from 72 Wisconsin counties.
WI Value
(26.4%)
The regional value is compared to the Wisconsin State value.
US Value
(26.7%)
The regional value is compared to the national value.
Prior Value
(30.1%)
Prior Value compares a measured value with the previously measured value. Confidence intervals were not taken into account in determining the direction of the comparison.
County: Marathon Adults with Medical Conditions Limiting Lifestyle
County: Marathon Adults with Medical Conditions Limiting Lifestyle
34.1%
(2023)
Compared to:
WI Value
(34.1%)
The regional value is compared to the Wisconsin State value.
US Value
(33.6%)
The regional value is compared to the national value.
Prior Value
(36.0%)
Prior Value compares a measured value with the previously measured value. Confidence intervals were not taken into account in determining the direction of the comparison.
County: Marathon Frequent Physical Distress
County: Marathon Frequent Physical Distress
10.6%
(2019)
Compared to:
WI Counties
The distribution is based on data from 72 Wisconsin counties.
U.S. Counties
The distribution is based on data from 3,121 U.S. counties and county equivalents.
WI Value
(10.7%)
The regional value is compared to the Wisconsin State value.
US Value
(12.0%)
The regional value is compared to the national value.
Prior Value
(11.4%)
Prior Value compares a measured value with the previously measured value. Confidence intervals were taken into account in determining the direction of the comparison.
County: Marathon Insufficient Sleep
County: Marathon Insufficient Sleep
31.8%
(2020)
Compared to:
WI Counties
The distribution is based on data from 72 Wisconsin counties.
U.S. Counties
The distribution is based on data from 3,140 U.S. counties and county equivalents.
WI Value
(31.2%)
The regional value is compared to the Wisconsin State value.
US Value
(33.0%)
The regional value is compared to the national value.
Prior Value
(34.4%)
Prior Value compares a measured value with the previously measured value. Confidence intervals were not taken into account in determining the direction of the comparison.
HP 2030 Target
(26.7%)
County: Marathon Poor Physical Health: 14+ Days
County: Marathon Poor Physical Health: 14+ Days
10.5%
(2021)
Compared to:
WI Counties
The distribution is based on data from 72 Wisconsin counties.
U.S. Counties
The distribution is based on data from 3,074 U.S. counties and county equivalents.
US Value
(10.9%)
The regional value is compared to the national value.
County: Marathon Self-Reported General Health Assessment: Poor or Fair
County: Marathon Self-Reported General Health Assessment: Poor or Fair
14.2%
(2020-2022)
Compared to:
WI Counties
The distribution is based on data from 57 Wisconsin counties.
WI Value
(13.7%)
The regional value is compared to the Wisconsin State value.
Prior Value
(11.2%)
Prior Value compares a measured value with the previously measured value. Confidence intervals were taken into account in determining the direction of the comparison.
Trend
This comparison measures the indicator’s values over multiple time periods.<br>The Mann-Kendall Test for Statistical Significance is used to evaluate the trend<br>over 4 to 10 periods of measure, subject to data availability and comparability.
County: Marathon
Health / Women's Health
Value
Compared to:
County: Marathon Prenatal Care for Moms in Nurse-Family Partnership
County: Marathon Prenatal Care for Moms in Nurse-Family Partnership
100.0%
(2023)
Compared to:
Prior Value
(0.0%)
Prior Value compares a measured value with the previously measured value. Confidence intervals were not taken into account in determining the direction of the comparison.
County: Marathon Women Receiving Nurse Family Partnership Services
County: Marathon Women Receiving Nurse Family Partnership Services
43
(2023)
Compared to:
Prior Value
Prior Value compares a measured value with the previously measured value. Confidence intervals were not taken into account in determining the direction of the comparison.
County: Marathon
Community
Value
Compared to:
County: Marathon Number of Animal Bites Reported
County: Marathon Number of Animal Bites Reported
382
Number
(2023)
Compared to:
Prior Value
(350)
Prior Value compares a measured value with the previously measured value. Confidence intervals were not taken into account in determining the direction of the comparison.
Trend
This comparison measures the indicator’s values over multiple time periods.<br>The Mann-Kendall Test for Statistical Significance is used to evaluate the trend<br>over 4 to 10 periods of measure, subject to data availability and comparability.
County: Marathon Number of Animal Quarantines at the Humane Society
County: Marathon Number of Animal Quarantines at the Humane Society
96
Number
(2023)
Compared to:
Prior Value
(67)
Prior Value compares a measured value with the previously measured value. Confidence intervals were not taken into account in determining the direction of the comparison.
Trend
This comparison measures the indicator’s values over multiple time periods.<br>The Mann-Kendall Test for Statistical Significance is used to evaluate the trend<br>over 4 to 10 periods of measure, subject to data availability and comparability.
