
Search for Indicators
All Data
Indicator Gauge Icon Legend
Legend Colors
Red is bad, green is good, blue is not statistically different/neutral.
Compared to Distribution
 the value is in the best half of communities.
 the value is in the 2nd worst quarter of communities.
 the value is in the worst quarter of communities.
Compared to Target
 meets target;
  does not meet target.
Compared to a Single Value
 lower than the comparison value;
 higher than the comparison value;
 not statistically different from comparison value.
Trend

 non-significant change over time;
 significant change over time;
  no change over time.
Compared to Prior Value
 higher than the previous measurement period;
 lower than the previous measurement period;
 no statistically different change from previous measurement period.
County: Marathon
Economy / Housing & Homes
Value
Compared to:
County: Marathon Severe Housing Problems
County: Marathon Severe Housing Problems
10.9%
(2016-2020)
Compared to:
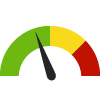
WI Counties
The distribution is based on data from 72 Wisconsin counties.
U.S. Counties
The distribution is based on data from 3,141 U.S. counties and county equivalents.
WI Value
(12.9%)
The regional value is compared to the Wisconsin State value.
US Value
(16.7%)
The regional value is compared to the national value.
Prior Value
(10.7%)
Prior Value compares a measured value with the previously measured value. Confidence intervals were taken into account in determining the direction of the comparison.
Trend
This comparison measures the indicator’s values over multiple time periods.<br>The Mann-Kendall Test for Statistical Significance is used to evaluate the trend<br>over 4 to 10 periods of measure, subject to data availability and comparability.
County: Marathon
Economy / Income
Value
Compared to:
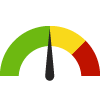
County: Marathon Average Annual Wage
County: Marathon Average Annual Wage
$54,919.0
(2022)
Compared to:

WI Value
($59,203.0)
The regional value is compared to the Wisconsin State value.
Prior Value
($52,502.0)
Prior Value compares a measured value with the previously measured value. Confidence intervals were not taken into account in determining the direction of the comparison.
Trend
This comparison measures the indicator’s values over multiple time periods.<br>The Mann-Kendall Test for Statistical Significance is used to evaluate the trend<br>over 4 to 10 periods of measure, subject to data availability and comparability.
County: Marathon Gender Pay Gap
County: Marathon Gender Pay Gap
$0.68
Cents on the dollar
(2022)
Compared to:

WI Value
($0.73)
The regional value is compared to the Wisconsin State value.
US Value
($0.73)
The regional value is compared to the national value.
Prior Value
($0.82)
Prior Value compares a measured value with the previously measured value. Confidence intervals were not taken into account in determining the direction of the comparison.
Trend
This comparison measures the indicator’s values over multiple time periods.<br>The Mann-Kendall Test for Statistical Significance is used to evaluate the trend<br>over 4 to 10 periods of measure, subject to data availability and comparability.
72.0%
(2021)
Compared to:
WI Counties
The distribution is based on data from 72 Wisconsin counties.
WI Value
(66.0%)
The regional value is compared to the Wisconsin State value.
Prior Value
(71.0%)
Prior Value compares a measured value with the previously measured value. Confidence intervals were not taken into account in determining the direction of the comparison.
20.3%
(2021)
Compared to:

WI Counties
The distribution is based on data from 72 Wisconsin counties.
WI Value
(23.0%)
The regional value is compared to the Wisconsin State value.
Prior Value
(21.6%)
Prior Value compares a measured value with the previously measured value. Confidence intervals were not taken into account in determining the direction of the comparison.
County: Marathon Income Inequality
County: Marathon Income Inequality
0.425
(2018-2022)
Compared to:

WI Counties
The distribution is based on data from 72 Wisconsin counties.
U.S. Counties
The distribution is based on data from 3,133 U.S. counties and county equivalents.
WI Value
(0.444)
The regional value is compared to the Wisconsin State value.
US Value
(0.483)
The regional value is compared to the national value.
Trend
This comparison measures the indicator’s values over multiple time periods.<br>The Mann-Kendall Test for Statistical Significance is used to evaluate the trend<br>over 4 to 10 periods of measure, subject to data availability and comparability.
County: Marathon Median Household Income
County: Marathon Median Household Income
$73,248
(2018-2022)
Compared to:
WI Counties
The distribution is based on data from 72 Wisconsin counties.
U.S. Counties
The distribution is based on data from 3,132 U.S. counties and county equivalents.
WI Value
($72,458)
The regional value is compared to the Wisconsin State value.
US Value
($75,149)
The regional value is compared to the national value.
Trend
This comparison measures the indicator’s values over multiple time periods.<br>The Mann-Kendall Test for Statistical Significance is used to evaluate the trend<br>over 4 to 10 periods of measure, subject to data availability and comparability.
County: Marathon Per Capita Income
County: Marathon Per Capita Income
$38,886
(2018-2022)
Compared to:
WI Counties
The distribution is based on data from 72 Wisconsin counties.
U.S. Counties
The distribution is based on data from 3,133 U.S. counties and county equivalents.
WI Value
($40,130)
The regional value is compared to the Wisconsin State value.
US Value
($41,261)
The regional value is compared to the national value.
Trend
This comparison measures the indicator’s values over multiple time periods.<br>The Mann-Kendall Test for Statistical Significance is used to evaluate the trend<br>over 4 to 10 periods of measure, subject to data availability and comparability.
County: Marathon
Economy / Investment & Personal Finance
Value
Compared to:
County: Marathon Adults who Feel Overwhelmed by Financial Burdens
County: Marathon Adults who Feel Overwhelmed by Financial Burdens
36.7%
(2023)
Compared to:

WI Counties
The distribution is based on data from 72 Wisconsin counties.
U.S. Counties
The distribution is based on data from 3,141 U.S. counties and county equivalents.
WI Value
(37.3%)
The regional value is compared to the Wisconsin State value.
US Value
(37.6%)
The regional value is compared to the national value.
Prior Value
(43.9%)
Prior Value compares a measured value with the previously measured value. Confidence intervals were not taken into account in determining the direction of the comparison.
County: Marathon Marathon County Residents without Savings
County: Marathon Marathon County Residents without Savings
36%
(2022)
Compared to:
Prior Value
(42%)
Prior Value compares a measured value with the previously measured value. Confidence intervals were not taken into account in determining the direction of the comparison.
Trend
This comparison measures the indicator’s values over multiple time periods.<br>The Mann-Kendall Test for Statistical Significance is used to evaluate the trend<br>over 4 to 10 periods of measure, subject to data availability and comparability.
County: Marathon
Economy / Poverty
Value
Compared to:
County: Marathon Children Living Below Poverty Level
County: Marathon Children Living Below Poverty Level
9.8%
(2018-2022)
Compared to:
WI Counties
The distribution is based on data from 72 Wisconsin counties.
U.S. Counties
The distribution is based on data from 3,132 U.S. counties and county equivalents.
WI Value
(13.3%)
The regional value is compared to the Wisconsin State value.
US Value
(16.7%)
The regional value is compared to the national value.
Trend
This comparison measures the indicator’s values over multiple time periods.<br>The Mann-Kendall Test for Statistical Significance is used to evaluate the trend<br>over 4 to 10 periods of measure, subject to data availability and comparability.
County: Marathon Families Living Below Poverty Level
County: Marathon Families Living Below Poverty Level
4.9%
(2018-2022)
Compared to:
WI Counties
The distribution is based on data from 72 Wisconsin counties.
U.S. Counties
The distribution is based on data from 3,104 U.S. counties and county equivalents.
WI Value
(6.6%)
The regional value is compared to the Wisconsin State value.
US Value
(8.8%)
The regional value is compared to the national value.
Trend
This comparison measures the indicator’s values over multiple time periods.<br>The Mann-Kendall Test for Statistical Significance is used to evaluate the trend<br>over 4 to 10 periods of measure, subject to data availability and comparability.
County: Marathon Households Living Below Poverty Level
County: Marathon Households Living Below Poverty Level
7.7%
(2021)
Compared to:


WI Counties
The distribution is based on data from 72 Wisconsin counties.
WI Value
(11.0%)
The regional value is compared to the Wisconsin State value.
Prior Value
(7.4%)
Prior Value compares a measured value with the previously measured value. Confidence intervals were not taken into account in determining the direction of the comparison.
County: Marathon People 65+ Living Below Poverty Level
County: Marathon People 65+ Living Below Poverty Level
7.5%
(2018-2022)
Compared to:
WI Counties
The distribution is based on data from 72 Wisconsin counties.
U.S. Counties
The distribution is based on data from 3,133 U.S. counties and county equivalents.
WI Value
(8.1%)
The regional value is compared to the Wisconsin State value.
US Value
(10.0%)
The regional value is compared to the national value.
Trend
This comparison measures the indicator’s values over multiple time periods.<br>The Mann-Kendall Test for Statistical Significance is used to evaluate the trend<br>over 4 to 10 periods of measure, subject to data availability and comparability.
County: Marathon People 65+ Living Below Poverty Level (Count)
County: Marathon People 65+ Living Below Poverty Level (Count)
1,850
People
(2018-2022)
Compared to:
Trend
This comparison measures the indicator’s values over multiple time periods.<br>The Mann-Kendall Test for Statistical Significance is used to evaluate the trend<br>over 4 to 10 periods of measure, subject to data availability and comparability.
County: Marathon People Living 200% Above Poverty Level
County: Marathon People Living 200% Above Poverty Level
76.9%
(2018-2022)
Compared to:
WI Counties
The distribution is based on data from 72 Wisconsin counties.
U.S. Counties
The distribution is based on data from 3,133 U.S. counties and county equivalents.
WI Value
(74.4%)
The regional value is compared to the Wisconsin State value.
US Value
(71.2%)
The regional value is compared to the national value.
Trend
This comparison measures the indicator’s values over multiple time periods.<br>The Mann-Kendall Test for Statistical Significance is used to evaluate the trend<br>over 4 to 10 periods of measure, subject to data availability and comparability.
County: Marathon People Living Below Poverty Level
County: Marathon People Living Below Poverty Level
8.3%
(2018-2022)
Compared to:
WI Counties
The distribution is based on data from 72 Wisconsin counties.
U.S. Counties
The distribution is based on data from 3,133 U.S. counties and county equivalents.
WI Value
(10.7%)
The regional value is compared to the Wisconsin State value.
US Value
(12.5%)
The regional value is compared to the national value.
Trend
This comparison measures the indicator’s values over multiple time periods.<br>The Mann-Kendall Test for Statistical Significance is used to evaluate the trend<br>over 4 to 10 periods of measure, subject to data availability and comparability.
HP 2030 Target
(8.0%)
County: Marathon Veterans Living Below Poverty Level
County: Marathon Veterans Living Below Poverty Level
4.9%
(2018-2022)
Compared to:
WI Counties
The distribution is based on data from 72 Wisconsin counties.
U.S. Counties
The distribution is based on data from 3,132 U.S. counties and county equivalents.
WI Value
(5.9%)
The regional value is compared to the Wisconsin State value.
US Value
(7.0%)
The regional value is compared to the national value.
Trend
This comparison measures the indicator’s values over multiple time periods.<br>The Mann-Kendall Test for Statistical Significance is used to evaluate the trend<br>over 4 to 10 periods of measure, subject to data availability and comparability.
County: Marathon Young Children Living Below Poverty Level
County: Marathon Young Children Living Below Poverty Level
10.3%
(2018-2022)
Compared to:
WI Counties
The distribution is based on data from 72 Wisconsin counties.
U.S. Counties
The distribution is based on data from 3,131 U.S. counties and county equivalents.
WI Value
(14.9%)
The regional value is compared to the Wisconsin State value.
US Value
(18.1%)
The regional value is compared to the national value.
Trend
This comparison measures the indicator’s values over multiple time periods.<br>The Mann-Kendall Test for Statistical Significance is used to evaluate the trend<br>over 4 to 10 periods of measure, subject to data availability and comparability.
County: Marathon Youth not in School or Working
County: Marathon Youth not in School or Working
1.7%
(2018-2022)
Compared to:

WI Counties
The distribution is based on data from 72 Wisconsin counties.
U.S. Counties
The distribution is based on data from 3,130 U.S. counties and county equivalents.
WI Value
(1.3%)
The regional value is compared to the Wisconsin State value.
US Value
(1.8%)
The regional value is compared to the national value.
Trend
This comparison measures the indicator’s values over multiple time periods.<br>The Mann-Kendall Test for Statistical Significance is used to evaluate the trend<br>over 4 to 10 periods of measure, subject to data availability and comparability.
County: Marathon
Education
Value
Compared to:
County: Marathon Economically Disadvantaged Students by School District
County: Marathon Economically Disadvantaged Students by School District
41.1%
Percent of students
(2023-2024)
Compared to:

Prior Value
(39.4%)
Prior Value compares a measured value with the previously measured value. Confidence intervals were not taken into account in determining the direction of the comparison.
Trend
This comparison measures the indicator’s values over multiple time periods.<br>The Mann-Kendall Test for Statistical Significance is used to evaluate the trend<br>over 4 to 10 periods of measure, subject to data availability and comparability.
County: Marathon Total Education Costs Per Pupil
County: Marathon Total Education Costs Per Pupil
$14,504
(2021-2022)
Compared to:


WI Value
($15,363)
The regional value is compared to the Wisconsin State value.
Prior Value
($14,567)
Prior Value compares a measured value with the previously measured value. Confidence intervals were not taken into account in determining the direction of the comparison.
Trend
This comparison measures the indicator’s values over multiple time periods.<br>The Mann-Kendall Test for Statistical Significance is used to evaluate the trend<br>over 4 to 10 periods of measure, subject to data availability and comparability.
County: Marathon
Education / Childcare & Early Childhood Education
Value
Compared to:
County: Marathon Average Wage for Child Care Director
County: Marathon Average Wage for Child Care Director
$20.30
(2022)
Compared to:
Prior Value
($17.75)
Prior Value compares a measured value with the previously measured value. Confidence intervals were not taken into account in determining the direction of the comparison.
Trend
This comparison measures the indicator’s values over multiple time periods.<br>The Mann-Kendall Test for Statistical Significance is used to evaluate the trend<br>over 4 to 10 periods of measure, subject to data availability and comparability.
County: Marathon Average Wage for Child Care Teacher
County: Marathon Average Wage for Child Care Teacher
$14.26
(2022)
Compared to:
Prior Value
($12.61)
Prior Value compares a measured value with the previously measured value. Confidence intervals were not taken into account in determining the direction of the comparison.
Trend
This comparison measures the indicator’s values over multiple time periods.<br>The Mann-Kendall Test for Statistical Significance is used to evaluate the trend<br>over 4 to 10 periods of measure, subject to data availability and comparability.
County: Marathon Average Weekly Rate for Family Child Care
County: Marathon Average Weekly Rate for Family Child Care
$164.06
(2022)
Compared to:
WI Value
($213.13)
The regional value is compared to the Wisconsin State value.
Prior Value
($159.46)
Prior Value compares a measured value with the previously measured value. Confidence intervals were not taken into account in determining the direction of the comparison.
Trend
This comparison measures the indicator’s values over multiple time periods.<br>The Mann-Kendall Test for Statistical Significance is used to evaluate the trend<br>over 4 to 10 periods of measure, subject to data availability and comparability.
County: Marathon Average Weekly Rate for Group Child Care
County: Marathon Average Weekly Rate for Group Child Care
$218.72
(2022)
Compared to:
WI Value
($266.58)
The regional value is compared to the Wisconsin State value.
Prior Value
($206.82)
Prior Value compares a measured value with the previously measured value. Confidence intervals were not taken into account in determining the direction of the comparison.
Trend
This comparison measures the indicator’s values over multiple time periods.<br>The Mann-Kendall Test for Statistical Significance is used to evaluate the trend<br>over 4 to 10 periods of measure, subject to data availability and comparability.
County: Marathon Child Care Centers
County: Marathon Child Care Centers
5.5
Per 1,000 population under age 5
(2022)
Compared to:
WI Counties
The distribution is based on data from 72 Wisconsin counties.
WI Value
(6.5)
The regional value is compared to the Wisconsin State value.
US Value
(7.0)
The regional value is compared to the national value.
Prior Value
(5.6)
Prior Value compares a measured value with the previously measured value. Confidence intervals were not taken into account in determining the direction of the comparison.
County: Marathon Number of Child Care Providers
County: Marathon Number of Child Care Providers
81
Number of providers
(2023)
Compared to:

Prior Value
(83)
Prior Value compares a measured value with the previously measured value. Confidence intervals were not taken into account in determining the direction of the comparison.
Trend
This comparison measures the indicator’s values over multiple time periods.<br>The Mann-Kendall Test for Statistical Significance is used to evaluate the trend<br>over 4 to 10 periods of measure, subject to data availability and comparability.
County: Marathon Total Capacity of Child Care Providers
County: Marathon Total Capacity of Child Care Providers
3,422
Child care slots
(2023)
Compared to:

Prior Value
(3,414)
Prior Value compares a measured value with the previously measured value. Confidence intervals were not taken into account in determining the direction of the comparison.
Trend
This comparison measures the indicator’s values over multiple time periods.<br>The Mann-Kendall Test for Statistical Significance is used to evaluate the trend<br>over 4 to 10 periods of measure, subject to data availability and comparability.
County: Marathon YoungStar Ratings in Marathon County
County: Marathon YoungStar Ratings in Marathon County
66.7%
Percent of providers
(2021)
Compared to:
Prior Value
(64.3%)
Prior Value compares a measured value with the previously measured value. Confidence intervals were not taken into account in determining the direction of the comparison.
Trend
This comparison measures the indicator’s values over multiple time periods.<br>The Mann-Kendall Test for Statistical Significance is used to evaluate the trend<br>over 4 to 10 periods of measure, subject to data availability and comparability.
County: Marathon
Education / Educational Attainment
Value
Compared to:
County: Marathon People 25+ with a Bachelor's Degree or Higher
County: Marathon People 25+ with a Bachelor's Degree or Higher
27.0%
(2018-2022)
Compared to:
WI Counties
The distribution is based on data from 72 Wisconsin counties.
U.S. Counties
The distribution is based on data from 3,133 U.S. counties and county equivalents.
WI Value
(32.0%)
The regional value is compared to the Wisconsin State value.
US Value
(34.3%)
The regional value is compared to the national value.
Trend
This comparison measures the indicator’s values over multiple time periods.<br>The Mann-Kendall Test for Statistical Significance is used to evaluate the trend<br>over 4 to 10 periods of measure, subject to data availability and comparability.
County: Marathon People 25+ with a High School Diploma or Higher
County: Marathon People 25+ with a High School Diploma or Higher
92.7%
(2018-2022)
Compared to:
WI Counties
The distribution is based on data from 72 Wisconsin counties.
U.S. Counties
The distribution is based on data from 3,133 U.S. counties and county equivalents.
WI Value
(93.1%)
The regional value is compared to the Wisconsin State value.
US Value
(89.1%)
The regional value is compared to the national value.
Trend
This comparison measures the indicator’s values over multiple time periods.<br>The Mann-Kendall Test for Statistical Significance is used to evaluate the trend<br>over 4 to 10 periods of measure, subject to data availability and comparability.
County: Marathon Post-Secondary Institution Enrollment
County: Marathon Post-Secondary Institution Enrollment
53.6%
Percent of students
(2022-2023)
Compared to:
Prior Value
(60.9%)
Prior Value compares a measured value with the previously measured value. Confidence intervals were not taken into account in determining the direction of the comparison.
Trend
This comparison measures the indicator’s values over multiple time periods.<br>The Mann-Kendall Test for Statistical Significance is used to evaluate the trend<br>over 4 to 10 periods of measure, subject to data availability and comparability.
County: Marathon Some College: 25-44
County: Marathon Some College: 25-44
70.0%
(2015-2019)
Compared to:
WI Value
(70%)
The regional value is compared to the Wisconsin state value.
Prior Value
(69.0%)
Prior Value compares a measured value with the previously measured value. Confidence intervals were taken into account in determining the direction of the comparison.
Trend
This comparison measures the indicator’s values over multiple time periods.<br>The Mann-Kendall Test for Statistical Significance is used to evaluate the trend<br>over 4 to 10 periods of measure, subject to data availability and comparability.
County: Marathon
Education / School Environment
Value
Compared to:
County: Marathon Student-to-Teacher Ratio
County: Marathon Student-to-Teacher Ratio
13.8
Students per teacher
(2022-2023)
Compared to:

WI Counties
The distribution is based on data from 72 Wisconsin counties.
U.S. Counties
The distribution is based on data from 3,125 U.S. counties and county equivalents.
WI Value
(13.7)
The regional value is compared to the Wisconsin State value.
US Value
(15.4)
The regional value is compared to the national value.
Prior Value
(13.9)
Prior Value compares a measured value with the previously measured value. Confidence intervals were not taken into account in determining the direction of the comparison.
Trend
This comparison measures the indicator’s values over multiple time periods.<br>The Mann-Kendall Test for Statistical Significance is used to evaluate the trend<br>over 4 to 10 periods of measure, subject to data availability and comparability.
County: Marathon Teens Who Felt Safe at School (Middle School)
County: Marathon Teens Who Felt Safe at School (Middle School)
81.0%
Percent of middle school students
(2021)
Compared to:
Prior Value
(82.0%)
Prior Value compares a measured value with the previously measured value. Confidence intervals were taken into account in determining the direction of the comparison.
County: Marathon
Education / Student Performance K-12
Value
Compared to:
County: Marathon Forward Exam Proficiency: English Language Arts
County: Marathon Forward Exam Proficiency: English Language Arts
40.4%
Percent of students
(2022-2023)
Compared to:
WI Value
(39.2%)
The regional value is compared to the Wisconsin State value.
Prior Value
(38.8%)
Prior Value compares a measured value with the previously measured value. Confidence intervals were not taken into account in determining the direction of the comparison.
Trend
This comparison measures the indicator’s values over multiple time periods.<br>The Mann-Kendall Test for Statistical Significance is used to evaluate the trend<br>over 4 to 10 periods of measure, subject to data availability and comparability.
County: Marathon Forward Exam Proficiency: Mathematics
County: Marathon Forward Exam Proficiency: Mathematics
46.6%
Percent of students
(2022-2023)
Compared to:
WI Value
(41.1%)
The regional value is compared to the Wisconsin State value.
Prior Value
(44.0%)
Prior Value compares a measured value with the previously measured value. Confidence intervals were not taken into account in determining the direction of the comparison.
County: Marathon Forward Exam Proficiency: Science
County: Marathon Forward Exam Proficiency: Science
51.7%
Percent of students
(2022-2023)
Compared to:
WI Value
(49.2%)
The regional value is compared to the Wisconsin State value.
Prior Value
(52.2%)
Prior Value compares a measured value with the previously measured value. Confidence intervals were not taken into account in determining the direction of the comparison.
Trend
This comparison measures the indicator’s values over multiple time periods.<br>The Mann-Kendall Test for Statistical Significance is used to evaluate the trend<br>over 4 to 10 periods of measure, subject to data availability and comparability.
County: Marathon Forward Exam Proficiency: Social Studies
County: Marathon Forward Exam Proficiency: Social Studies
56.0%
Percent of students
(2022-2023)
Compared to:
WI Value
(52.2%)
The regional value is compared to the Wisconsin State value.
Prior Value
(58.2%)
Prior Value compares a measured value with the previously measured value. Confidence intervals were not taken into account in determining the direction of the comparison.
Trend
This comparison measures the indicator’s values over multiple time periods.<br>The Mann-Kendall Test for Statistical Significance is used to evaluate the trend<br>over 4 to 10 periods of measure, subject to data availability and comparability.
County: Marathon High School Graduation
County: Marathon High School Graduation
94.5%
(2022-2023)
Compared to:
Prior Value
(93.0%)
Prior Value compares a measured value with the previously measured value. Confidence intervals were not taken into account in determining the direction of the comparison.
Trend
This comparison measures the indicator’s values over multiple time periods.<br>The Mann-Kendall Test for Statistical Significance is used to evaluate the trend<br>over 4 to 10 periods of measure, subject to data availability and comparability.
HP 2030 Target
(90.7%)
County: Marathon
Environmental Health
Value
Compared to:
County: Marathon Average Soil Erosion Rates
County: Marathon Average Soil Erosion Rates
2.5
Tons per Acre per Year
(2022)
Compared to:

Prior Value
(2.6)
Prior Value compares a measured value with the previously measured value. Confidence intervals were not taken into account in determining the direction of the comparison.
Trend
This comparison measures the indicator’s values over multiple time periods.<br>The Mann-Kendall Test for Statistical Significance is used to evaluate the trend<br>over 4 to 10 periods of measure, subject to data availability and comparability.
County: Marathon Marathon County Cropland At or Below Tolerable Soil Loss
County: Marathon Marathon County Cropland At or Below Tolerable Soil Loss
75.8%
Percent (%)
(2022)
Compared to:
Prior Value
(75.3%)
Prior Value compares a measured value with the previously measured value. Confidence intervals were not taken into account in determining the direction of the comparison.
Trend
This comparison measures the indicator’s values over multiple time periods.<br>The Mann-Kendall Test for Statistical Significance is used to evaluate the trend<br>over 4 to 10 periods of measure, subject to data availability and comparability.
County: Marathon Marathon County Residents Who Bought Product with Less Packaging
County: Marathon Marathon County Residents Who Bought Product with Less Packaging
19.0%
(2022)
Compared to:
Prior Value
(18.0%)
Prior Value compares a measured value with the previously measured value. Confidence intervals were not taken into account in determining the direction of the comparison.
Trend
This comparison measures the indicator’s values over multiple time periods.<br>The Mann-Kendall Test for Statistical Significance is used to evaluate the trend<br>over 4 to 10 periods of measure, subject to data availability and comparability.
County: Marathon Marathon County Residents Who Compost
County: Marathon Marathon County Residents Who Compost
29.0%
(2022)
Compared to:
Prior Value
(31.0%)
Prior Value compares a measured value with the previously measured value. Confidence intervals were not taken into account in determining the direction of the comparison.
Trend
This comparison measures the indicator’s values over multiple time periods.<br>The Mann-Kendall Test for Statistical Significance is used to evaluate the trend<br>over 4 to 10 periods of measure, subject to data availability and comparability.
County: Marathon Marathon County Residents Who Disposed of Items through Donation
County: Marathon Marathon County Residents Who Disposed of Items through Donation
64.0%
(2022)
Compared to:
Prior Value
(71.0%)
Prior Value compares a measured value with the previously measured value. Confidence intervals were not taken into account in determining the direction of the comparison.
Trend
This comparison measures the indicator’s values over multiple time periods.<br>The Mann-Kendall Test for Statistical Significance is used to evaluate the trend<br>over 4 to 10 periods of measure, subject to data availability and comparability.
County: Marathon Marathon County Residents Who Properly Dispose of Hazardous Waste
County: Marathon Marathon County Residents Who Properly Dispose of Hazardous Waste
13.0%
(2022)
Compared to:
Prior Value
(20.0%)
Prior Value compares a measured value with the previously measured value. Confidence intervals were not taken into account in determining the direction of the comparison.
Trend
This comparison measures the indicator’s values over multiple time periods.<br>The Mann-Kendall Test for Statistical Significance is used to evaluate the trend<br>over 4 to 10 periods of measure, subject to data availability and comparability.
County: Marathon Marathon County Residents Who Re-Use Materials
County: Marathon Marathon County Residents Who Re-Use Materials
42.0%
(2022)
Compared to:
Prior Value
(40.0%)
Prior Value compares a measured value with the previously measured value. Confidence intervals were not taken into account in determining the direction of the comparison.
Trend
This comparison measures the indicator’s values over multiple time periods.<br>The Mann-Kendall Test for Statistical Significance is used to evaluate the trend<br>over 4 to 10 periods of measure, subject to data availability and comparability.
County: Marathon Marathon County Residents Who Recycle
County: Marathon Marathon County Residents Who Recycle
81.0%
(2022)
Compared to:
Prior Value
(86.0%)
Prior Value compares a measured value with the previously measured value. Confidence intervals were not taken into account in determining the direction of the comparison.
Trend
This comparison measures the indicator’s values over multiple time periods.<br>The Mann-Kendall Test for Statistical Significance is used to evaluate the trend<br>over 4 to 10 periods of measure, subject to data availability and comparability.
County: Marathon Marathon County Residents Who Use a Medication Drop Box
County: Marathon Marathon County Residents Who Use a Medication Drop Box
24.0%
(2022)
Compared to:
Prior Value
(27.0%)
Prior Value compares a measured value with the previously measured value. Confidence intervals were not taken into account in determining the direction of the comparison.
Trend
This comparison measures the indicator’s values over multiple time periods.<br>The Mann-Kendall Test for Statistical Significance is used to evaluate the trend<br>over 4 to 10 periods of measure, subject to data availability and comparability.
County: Marathon Number of Inspections of Licensed Facilities
County: Marathon Number of Inspections of Licensed Facilities
1,027
Number
(2023)
Compared to:
Prior Value
(942)
Prior Value compares a measured value with the previously measured value. Confidence intervals were not taken into account in determining the direction of the comparison.
Trend
This comparison measures the indicator’s values over multiple time periods.<br>The Mann-Kendall Test for Statistical Significance is used to evaluate the trend<br>over 4 to 10 periods of measure, subject to data availability and comparability.
County: Marathon Number of Licensed Facilities with Outbreak Investigations
County: Marathon Number of Licensed Facilities with Outbreak Investigations
0
Number
(2023)
Compared to:
Prior Value
(2)
Prior Value compares a measured value with the previously measured value. Confidence intervals were not taken into account in determining the direction of the comparison.
Trend
This comparison measures the indicator’s values over multiple time periods.<br>The Mann-Kendall Test for Statistical Significance is used to evaluate the trend<br>over 4 to 10 periods of measure, subject to data availability and comparability.
County: Marathon Number of Water Samples Tested
County: Marathon Number of Water Samples Tested
3,542
Number
(2023)
Compared to:
Prior Value
(3,760)
Prior Value compares a measured value with the previously measured value. Confidence intervals were not taken into account in determining the direction of the comparison.
Trend
This comparison measures the indicator’s values over multiple time periods.<br>The Mann-Kendall Test for Statistical Significance is used to evaluate the trend<br>over 4 to 10 periods of measure, subject to data availability and comparability.
County: Marathon Number of Water Samples with Safe Levels of Coliform Bacteria
County: Marathon Number of Water Samples with Safe Levels of Coliform Bacteria
2,938
Number
(2023)
Compared to:
Prior Value
(3,031)
Prior Value compares a measured value with the previously measured value. Confidence intervals were not taken into account in determining the direction of the comparison.
Trend
This comparison measures the indicator’s values over multiple time periods.<br>The Mann-Kendall Test for Statistical Significance is used to evaluate the trend<br>over 4 to 10 periods of measure, subject to data availability and comparability.
County: Marathon Number of Water Samples with Unsafe Bacteria Levels
County: Marathon Number of Water Samples with Unsafe Bacteria Levels
277
Number
(2023)
Compared to:
Prior Value
(395)
Prior Value compares a measured value with the previously measured value. Confidence intervals were not taken into account in determining the direction of the comparison.
Trend
This comparison measures the indicator’s values over multiple time periods.<br>The Mann-Kendall Test for Statistical Significance is used to evaluate the trend<br>over 4 to 10 periods of measure, subject to data availability and comparability.
County: Marathon Percent of Re-Inspections
County: Marathon Percent of Re-Inspections
5.5%
(2023)
Compared to:
Prior Value
(6.2%)
Prior Value compares a measured value with the previously measured value. Confidence intervals were not taken into account in determining the direction of the comparison.
Trend
This comparison measures the indicator’s values over multiple time periods.<br>The Mann-Kendall Test for Statistical Significance is used to evaluate the trend<br>over 4 to 10 periods of measure, subject to data availability and comparability.
County: Marathon
Environmental Health / Air
Value
Compared to:
County: Marathon Air Pollutant Emissions- Fine Particulate Matter (PM 2.5)
County: Marathon Air Pollutant Emissions- Fine Particulate Matter (PM 2.5)
2,027
Tons
(2021)
Compared to:
Prior Value
(2,014)
Prior Value compares a measured value with the previously measured value. Confidence intervals were not taken into account in determining the direction of the comparison.
Trend
This comparison measures the indicator’s values over multiple time periods.<br>The Mann-Kendall Test for Statistical Significance is used to evaluate the trend<br>over 4 to 10 periods of measure, subject to data availability and comparability.
County: Marathon Air Pollutant Emissions- Nitrogen Oxide (NOx)
County: Marathon Air Pollutant Emissions- Nitrogen Oxide (NOx)
4,826
Tons
(2021)
Compared to:
Prior Value
(4,618)
Prior Value compares a measured value with the previously measured value. Confidence intervals were not taken into account in determining the direction of the comparison.
Trend
This comparison measures the indicator’s values over multiple time periods.<br>The Mann-Kendall Test for Statistical Significance is used to evaluate the trend<br>over 4 to 10 periods of measure, subject to data availability and comparability.
County: Marathon Air Pollutant Emissions- Sulfur Dioxide (SO2)
County: Marathon Air Pollutant Emissions- Sulfur Dioxide (SO2)
1,913
Tons
(2021)
Compared to:
Prior Value
(1,769)
Prior Value compares a measured value with the previously measured value. Confidence intervals were not taken into account in determining the direction of the comparison.
Trend
This comparison measures the indicator’s values over multiple time periods.<br>The Mann-Kendall Test for Statistical Significance is used to evaluate the trend<br>over 4 to 10 periods of measure, subject to data availability and comparability.
County: Marathon Air Pollutant Emissions- Volatile Organic Compounds (VOC)
County: Marathon Air Pollutant Emissions- Volatile Organic Compounds (VOC)
4,482
Tons
(2021)
Compared to:
Prior Value
(4,337)
Prior Value compares a measured value with the previously measured value. Confidence intervals were not taken into account in determining the direction of the comparison.
Trend
This comparison measures the indicator’s values over multiple time periods.<br>The Mann-Kendall Test for Statistical Significance is used to evaluate the trend<br>over 4 to 10 periods of measure, subject to data availability and comparability.
County: Marathon Annual Ozone Air Quality
County: Marathon Annual Ozone Air Quality
1
(2019-2021)
Compared to:
Air Quality Index
The American Lung Association (ALA) assigns grades A-F to counties (A=1; B=2; C=3; D=4; F=5), based on average annual number of days that ozone levels exceeded U.S. standards during the three year measurement period. The five-point grading scale was used for the distribution (Green = <2; Yellow = 2 - 3; Red = >3). The air quality data is collected by the EPA and summarized by the ALA.
Prior Value
(1)
Prior Value compares a measured value with the previously measured value. Confidence intervals were not taken into account in determining the direction of the comparison.
Trend
This comparison measures the indicator’s values over multiple time periods.<br>The Mann-Kendall Test for Statistical Significance is used to evaluate the trend<br>over 4 to 10 periods of measure, subject to data availability and comparability.
County: Marathon Number of Radon Test Kits Sold
County: Marathon Number of Radon Test Kits Sold
212
Number
(2023)
Compared to:
Prior Value
(294)
Prior Value compares a measured value with the previously measured value. Confidence intervals were not taken into account in determining the direction of the comparison.
Trend
This comparison measures the indicator’s values over multiple time periods.<br>The Mann-Kendall Test for Statistical Significance is used to evaluate the trend<br>over 4 to 10 periods of measure, subject to data availability and comparability.
County: Marathon Percent of Radon Test Kits Returned for Results
County: Marathon Percent of Radon Test Kits Returned for Results
46.7%
(2023)
Compared to:
Prior Value
(63.0%)
Prior Value compares a measured value with the previously measured value. Confidence intervals were not taken into account in determining the direction of the comparison.
Trend
This comparison measures the indicator’s values over multiple time periods.<br>The Mann-Kendall Test for Statistical Significance is used to evaluate the trend<br>over 4 to 10 periods of measure, subject to data availability and comparability.
County: Marathon Percent of Radon Tests with Elevated Levels
County: Marathon Percent of Radon Tests with Elevated Levels
57%
Percent of radon tests
(2023)
Compared to:
Prior Value
(55%)
Prior Value compares a measured value with the previously measured value. Confidence intervals were not taken into account in determining the direction of the comparison.
Trend
This comparison measures the indicator’s values over multiple time periods.<br>The Mann-Kendall Test for Statistical Significance is used to evaluate the trend<br>over 4 to 10 periods of measure, subject to data availability and comparability.
County: Marathon Recognized Carcinogens Released into Air
County: Marathon Recognized Carcinogens Released into Air
34,196
Pounds
(2022)
Compared to:
Prior Value
(20,446)
Prior Value compares a measured value with the previously measured value. Confidence intervals were not taken into account in determining the direction of the comparison.
Trend
This comparison measures the indicator’s values over multiple time periods.<br>The Mann-Kendall Test for Statistical Significance is used to evaluate the trend<br>over 4 to 10 periods of measure, subject to data availability and comparability.
County: Marathon
Environmental Health / Built Environment
Value
Compared to:
County: Marathon Access to Exercise Opportunities
County: Marathon Access to Exercise Opportunities
73.3%
(2024)
Compared to:
WI Counties
The distribution is based on data from 72 Wisconsin counties.
U.S. Counties
The distribution is based on data from 3,096 U.S. counties and county equivalents.
WI Value
(83.7%)
The regional value is compared to the Wisconsin State value.
US Value
(84.1%)
The regional value is compared to the national value.
Prior Value
(72.1%)
Prior Value compares a measured value with the previously measured value. Confidence intervals were not taken into account in determining the direction of the comparison.
County: Marathon Access to Parks
County: Marathon Access to Parks
0.5%
(2020)
Compared to:
WI Counties
The distribution is based on data from 72 Wisconsin counties.
WI Value
(59.9%)
The regional value is compared to the Wisconsin State value.
Prior Value
(0.3%)
Prior Value compares a measured value with the previously measured value. Confidence intervals were not taken into account in determining the direction of the comparison.
County: Marathon Food Environment Index
County: Marathon Food Environment Index
8.9
(2024)
Compared to:
WI Counties
The distribution is based on data from 71 Wisconsin counties.
U.S. Counties
The distribution is based on data from 3,108 U.S. counties and county equivalents.
WI Value
(9.1)
The regional value is compared to the Wisconsin State value.
US Value
(7.7)
The regional value is compared to the national value.
Prior Value
(8.7)
Prior Value compares a measured value with the previously measured value. Confidence intervals were not taken into account in determining the direction of the comparison.
Trend
This comparison measures the indicator’s values over multiple time periods.<br>The Mann-Kendall Test for Statistical Significance is used to evaluate the trend<br>over 4 to 10 periods of measure, subject to data availability and comparability.
County: Marathon Liquor Store Density
County: Marathon Liquor Store Density
0.7
Stores per 100,000 population
(2015)
Compared to:
WI Counties
The distribution is based on data from 59 Wisconsin counties.
U.S. Counties
The distribution is based on data from 2,438 U.S. counties and county equivalents.
WI Value
(7.0)
The regional value is compared to the Wisconsin State value.
US Value
(10.5)
The regional value is compared to the national value.
Prior Value
(0.7)
Prior Value compares a measured value with the previously measured value. Confidence intervals were not taken into account in determining the direction of the comparison.
Trend
This comparison measures the indicator’s values over multiple time periods.<br>The Mann-Kendall Test for Statistical Significance is used to evaluate the trend<br>over 4 to 10 periods of measure, subject to data availability and comparability.
County: Marathon Number of Childhood Lead Tests in Marathon County
County: Marathon Number of Childhood Lead Tests in Marathon County
1,413
(2023)
Compared to:
Prior Value
(1,367)
Prior Value compares a measured value with the previously measured value. Confidence intervals were not taken into account in determining the direction of the comparison.
Trend
This comparison measures the indicator’s values over multiple time periods.<br>The Mann-Kendall Test for Statistical Significance is used to evaluate the trend<br>over 4 to 10 periods of measure, subject to data availability and comparability.
County: Marathon Number of Housing Units that Completed Lead Hazard Reduction
County: Marathon Number of Housing Units that Completed Lead Hazard Reduction
3
Number
(2023)
Compared to:
Prior Value
(3)
Prior Value compares a measured value with the previously measured value. Confidence intervals were not taken into account in determining the direction of the comparison.
Trend
This comparison measures the indicator’s values over multiple time periods.<br>The Mann-Kendall Test for Statistical Significance is used to evaluate the trend<br>over 4 to 10 periods of measure, subject to data availability and comparability.
County: Marathon Proximity to Highways
County: Marathon Proximity to Highways
0.0%
(2020)
Compared to:
WI Value
(0.0%)
The regional value is compared to the Wisconsin State value.
Prior Value
(0.0%)
Prior Value compares a measured value with the previously measured value. Confidence intervals were not taken into account in determining the direction of the comparison.
County: Marathon
Environmental Health / Energy & Sustainability
Value
Compared to:
County: Marathon Energy Bill Savings for Focus on Energy Participants
County: Marathon Energy Bill Savings for Focus on Energy Participants
$188
(2022)
Compared to:
Prior Value
($69)
Prior Value compares a measured value with the previously measured value. Confidence intervals were not taken into account in determining the direction of the comparison.
Trend
This comparison measures the indicator’s values over multiple time periods.<br>The Mann-Kendall Test for Statistical Significance is used to evaluate the trend<br>over 4 to 10 periods of measure, subject to data availability and comparability.
County: Marathon Number of Residents Receiving Focus on Energy Incentives
County: Marathon Number of Residents Receiving Focus on Energy Incentives
3,646
Number of Residents
(2022)
Compared to:


Prior Value
(3,342)
Prior Value compares a measured value with the previously measured value. Confidence intervals were not taken into account in determining the direction of the comparison.
Trend
This comparison measures the indicator’s values over multiple time periods.<br>The Mann-Kendall Test for Statistical Significance is used to evaluate the trend<br>over 4 to 10 periods of measure, subject to data availability and comparability.
County: Marathon
Environmental Health / Toxins & Contaminants
Value
Compared to:
County: Marathon Age-Adjusted Carbon Monoxide Poisoning ED Visit Rate
County: Marathon Age-Adjusted Carbon Monoxide Poisoning ED Visit Rate
6.7
ED visits per 100,000 population
(2018-2022)
Compared to:
WI Counties
The distribution is based on data from 72 Wisconsin counties.
Prior Value
(7.4)
Prior Value compares a measured value with the previously measured value. Confidence intervals were not taken into account in determining the direction of the comparison.
Trend
This comparison measures the indicator’s values over multiple time periods.<br>The Mann-Kendall Test for Statistical Significance is used to evaluate the trend<br>over 4 to 10 periods of measure, subject to data availability and comparability.
County: Marathon Houses Built Prior to 1950
County: Marathon Houses Built Prior to 1950
22.0%
(2018-2022)
Compared to:
WI Counties
The distribution is based on data from 72 Wisconsin counties.
U.S. Counties
The distribution is based on data from 3,133 U.S. counties and county equivalents.
WI Value
(23.9%)
The regional value is compared to the Wisconsin State value.
US Value
(16.7%)
The regional value is compared to the national value.
Trend
This comparison measures the indicator’s values over multiple time periods.<br>The Mann-Kendall Test for Statistical Significance is used to evaluate the trend<br>over 4 to 10 periods of measure, subject to data availability and comparability.
County: Marathon Number of Miles of Phosphorus Impaired Streams
County: Marathon Number of Miles of Phosphorus Impaired Streams
263
Number of miles
(2022)
Compared to:
Prior Value
(262)
Prior Value compares a measured value with the previously measured value. Confidence intervals were not taken into account in determining the direction of the comparison.
Trend
This comparison measures the indicator’s values over multiple time periods.<br>The Mann-Kendall Test for Statistical Significance is used to evaluate the trend<br>over 4 to 10 periods of measure, subject to data availability and comparability.
County: Marathon PBT Released
County: Marathon PBT Released
23,115
Pounds
(2022)
Compared to:
Prior Value
(20,396)
Prior Value compares a measured value with the previously measured value. Confidence intervals were not taken into account in determining the direction of the comparison.
Trend
This comparison measures the indicator’s values over multiple time periods.<br>The Mann-Kendall Test for Statistical Significance is used to evaluate the trend<br>over 4 to 10 periods of measure, subject to data availability and comparability.
85%
(2022)
Compared to:
Prior Value
(92%)
Prior Value compares a measured value with the previously measured value. Confidence intervals were not taken into account in determining the direction of the comparison.
Trend
This comparison measures the indicator’s values over multiple time periods.<br>The Mann-Kendall Test for Statistical Significance is used to evaluate the trend<br>over 4 to 10 periods of measure, subject to data availability and comparability.
County: Marathon Percentage of Private Well Water Samples Testing Safe for Fluoride
County: Marathon Percentage of Private Well Water Samples Testing Safe for Fluoride
95%
(2022)
Compared to:
Prior Value
(89%)
Prior Value compares a measured value with the previously measured value. Confidence intervals were not taken into account in determining the direction of the comparison.
Trend
This comparison measures the indicator’s values over multiple time periods.<br>The Mann-Kendall Test for Statistical Significance is used to evaluate the trend<br>over 4 to 10 periods of measure, subject to data availability and comparability.
County: Marathon Percentage of Private Well Water Samples Testing Safe for Nitrate
County: Marathon Percentage of Private Well Water Samples Testing Safe for Nitrate
88%
(2022)
Compared to:
Prior Value
(91%)
Prior Value compares a measured value with the previously measured value. Confidence intervals were not taken into account in determining the direction of the comparison.
Trend
This comparison measures the indicator’s values over multiple time periods.<br>The Mann-Kendall Test for Statistical Significance is used to evaluate the trend<br>over 4 to 10 periods of measure, subject to data availability and comparability.
County: Marathon
Environmental Health / Weather & Climate
Value
Compared to:
County: Marathon Daily Dose of UV Irradiance
County: Marathon Daily Dose of UV Irradiance
2,910.0
Joule per square meter
(2020)
Compared to:
WI Counties
The distribution is based on data from 72 Wisconsin counties.
WI Value
(3,005.0)
The regional value is compared to the Wisconsin State value.
Prior Value
(2,552.0)
Prior Value compares a measured value with the previously measured value. Confidence intervals were not taken into account in determining the direction of the comparison.
Trend
This comparison measures the indicator’s values over multiple time periods.<br>The Mann-Kendall Test for Statistical Significance is used to evaluate the trend<br>over 4 to 10 periods of measure, subject to data availability and comparability.
County: Marathon Months of Mild Drought or Worse
County: Marathon Months of Mild Drought or Worse
6
Months per year
(2016)
Compared to:
Prior Value
(5)
Prior Value compares a measured value with the previously measured value. Confidence intervals were not taken into account in determining the direction of the comparison.
Trend
This comparison measures the indicator’s values over multiple time periods.<br>The Mann-Kendall Test for Statistical Significance is used to evaluate the trend<br>over 4 to 10 periods of measure, subject to data availability and comparability.
County: Marathon Number of Extreme Heat Days
County: Marathon Number of Extreme Heat Days
15
Days
(2022)
Compared to:
Prior Value
(15)
Prior Value compares a measured value with the previously measured value. Confidence intervals were not taken into account in determining the direction of the comparison.
Trend
This comparison measures the indicator’s values over multiple time periods.<br>The Mann-Kendall Test for Statistical Significance is used to evaluate the trend<br>over 4 to 10 periods of measure, subject to data availability and comparability.
County: Marathon Number of Extreme Heat Events
County: Marathon Number of Extreme Heat Events
10
Events
(2022)
Compared to:
Prior Value
(11)
Prior Value compares a measured value with the previously measured value. Confidence intervals were not taken into account in determining the direction of the comparison.
Trend
This comparison measures the indicator’s values over multiple time periods.<br>The Mann-Kendall Test for Statistical Significance is used to evaluate the trend<br>over 4 to 10 periods of measure, subject to data availability and comparability.
County: Marathon Number of Extreme Precipitation Days
County: Marathon Number of Extreme Precipitation Days
2
Days
(2023)
Compared to:
Prior Value
(28)
Prior Value compares a measured value with the previously measured value. Confidence intervals were not taken into account in determining the direction of the comparison.
Trend
This comparison measures the indicator’s values over multiple time periods.<br>The Mann-Kendall Test for Statistical Significance is used to evaluate the trend<br>over 4 to 10 periods of measure, subject to data availability and comparability.
County: Marathon Weeks of Moderate Drought or Worse
County: Marathon Weeks of Moderate Drought or Worse
0
Weeks per year
(2021)
Compared to:
Prior Value
Prior Value compares a measured value with the previously measured value. Confidence intervals were not taken into account in determining the direction of the comparison.
Trend
This comparison measures the indicator’s values over multiple time periods.<br>The Mann-Kendall Test for Statistical Significance is used to evaluate the trend<br>over 4 to 10 periods of measure, subject to data availability and comparability.
County: Marathon
Environmental Health / Wildlife
Value
Compared to:
35
Number
(2023)
Compared to:
Prior Value
(29)
Prior Value compares a measured value with the previously measured value. Confidence intervals were not taken into account in determining the direction of the comparison.
Trend
This comparison measures the indicator’s values over multiple time periods.<br>The Mann-Kendall Test for Statistical Significance is used to evaluate the trend<br>over 4 to 10 periods of measure, subject to data availability and comparability.
